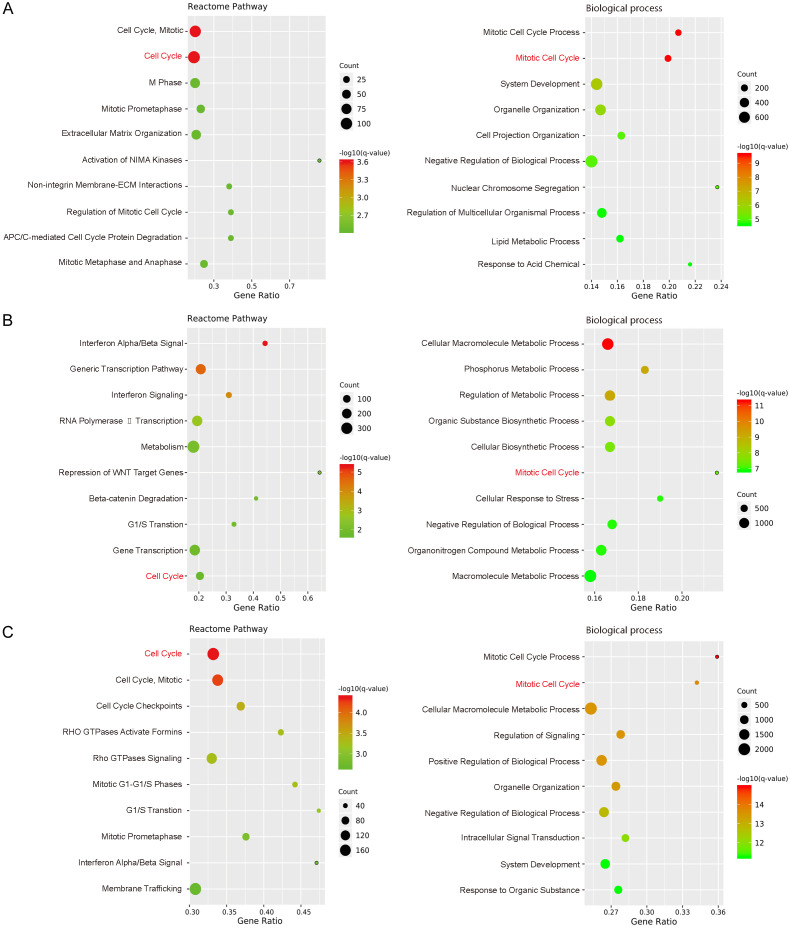
Figure 3.
Transcriptome analysis of NFYA-regulated genes and processes. A-C. Differentially expressed genes (fold change ≥ 1.5 and FDR ≤ 0.001) in ACHN (A), 769-P (B) and A498 (C) cells upon NFYA knockdown were analyzed in ConsensusPathDB. The top 10 Reactome pathways and biological processes were displayed.

