Figure 1.

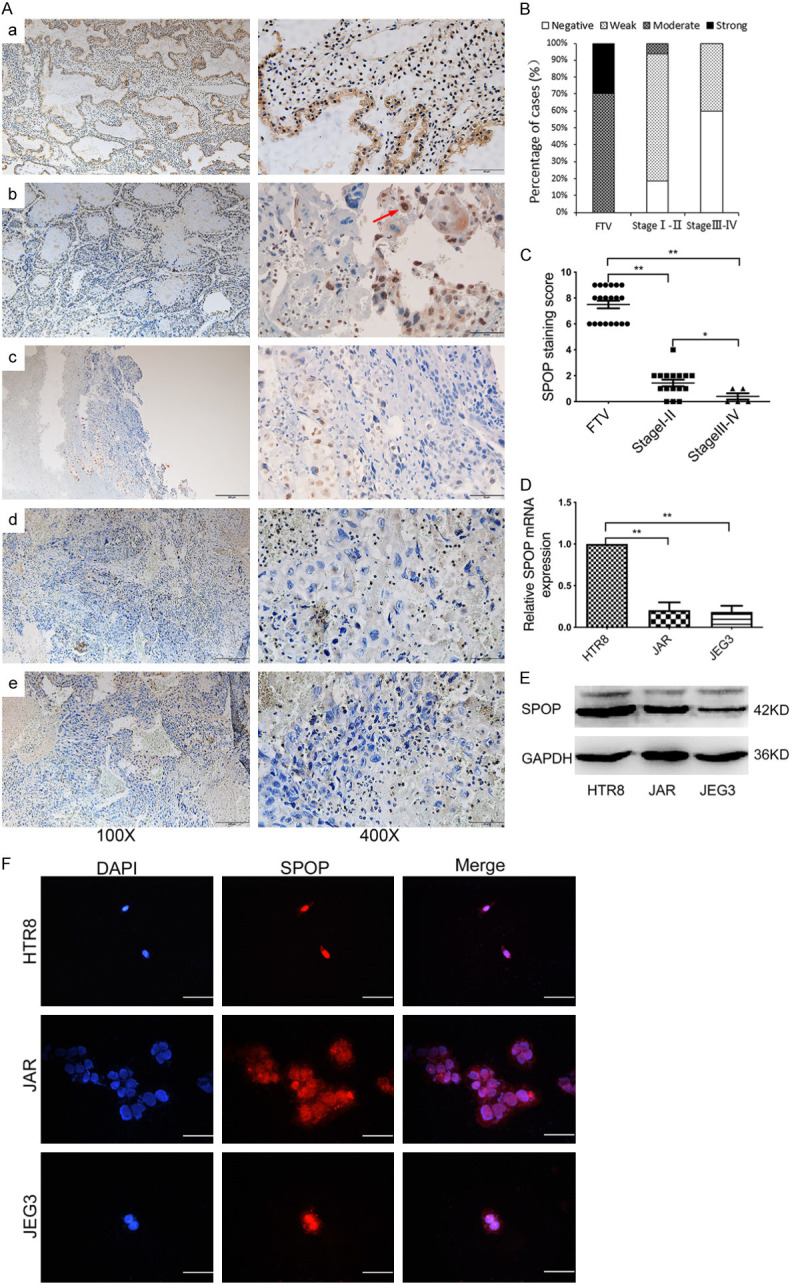
The expression and localization of SPOP in choriocarcinoma tissues and cell lines. (A) The representative images of SPOP expression in FTV (a) and images of TNM stage I (b), stage II (c), stage III (d), stage IV (e) SPOP expression in the tumor tissues, as measured by IHC. Red arrow indicated cytoplasmic and nuclear location of SPOP. FTV=20, TNM stage I=11, stage II=5, stage III =3, stage IV=2. Scale bar, 200 um (left) and 50 um (right), respectively. (B) Percentage analysis of SPOP staining intensity in 21 cases of choriocarcinoma. (C) Comparison of average SPOP staining scores among different TNM stages, showing inversely correlation of SPOP with tumor progression. SPOP mRNA (D) and protein (E) levels in HTR8, JAR and JEG3 cells were analyzed using qRT-PCR and immunoblotting (IB) analysis, respectively. *P < 0.05, **P < 0.01, compared to control groups. (F) Immunofluorescence for HTR8, JAR and JEG3 cells were stained with SPOP antibody (red), and the nuclei were counterstained with DAPI (blue). Scale bar, 50 um.
