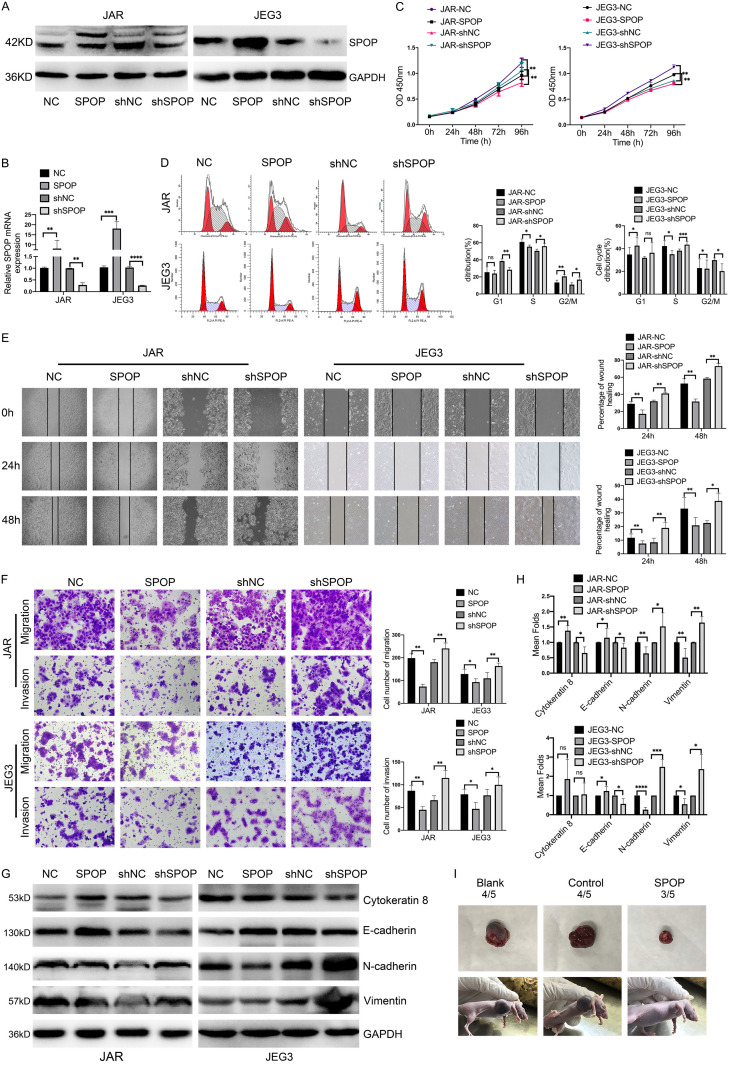
Figure 2.
The expression of SPOP was associated with choriocarcinoma cells proliferation, migration and invasion both in vitro and vivo. (A and B) SPOP knockdown and overexpression in JAR and JEG3 cells were confirmed by immunoblotting (A) and qRT-PCR (B), respectively. (C) Increased or decreased expression of SPOP in JAR and JEG3 cells affected cell proliferation examined by CCK8 assays. (D) Cell cycle analysis of JAR and JEG3 cells after SPOP overexpression and knockdown using flow cytometry. Percentage of cells in G1, S and G2/M phases is shown in the right panel. (E) Wound healing assay showing JAR and JEG3 cells migration abilities at 0, 24 h and 48 h after SPOP overexpression and knockdown, the percentage of wound healing was measured by Image J software. Quantification of the wound closure is presented on the right panel. (F) Transwell assays showing the migration and invasion abilities after SPOP overexpression and knockdown in JAR and JEG3 cells. Results were evaluated as the average number of migrating and invading cells from six random microscope fields. Quantification of the invaded or migrated cells is shown in the right panel. (G) IB analysis of E-cadherin, Cytokeratin 8, N-cadherin and vimentin after up-regulating or down-regulating SPOP in JAR and JEG3 cells. (H) The relative protein abundance of EMT related proteins was quantified by Image Lab software and normalized with control cells. (I) Tumorigenesis ability of JAR cells in a xenograft model after SPOP overexpression. Each experiment was repeated at least three times (mean ± SD), *P < 0.05, **P < 0.01, ***P < 0.001, ****P < 0.0001, compared to control groups.

