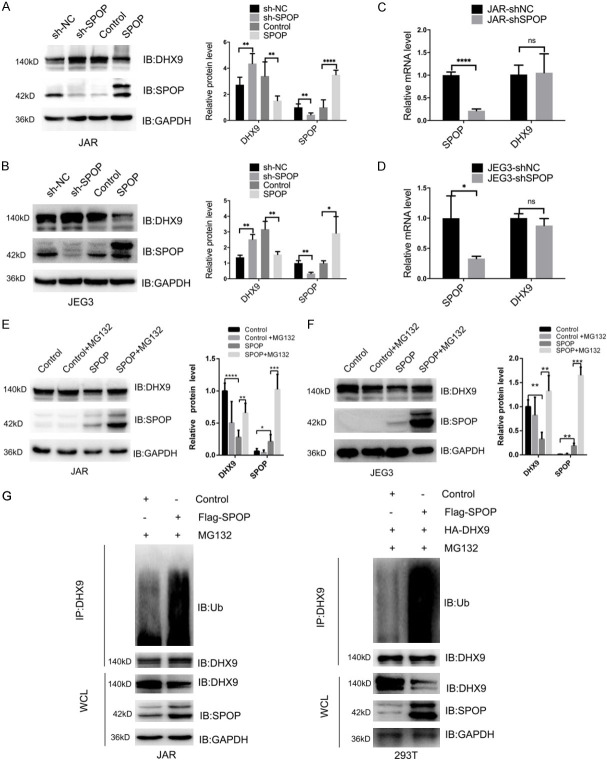
Figure 5.
SPOP promotes the degradation and ubiquitination of DHX9. (A and B) IB analysis of SPOP and DHX9 protein levels derived from JAR cells (A) or JEG3 cells (B) transfected with the indicated constructs. (C and D) Detection of SPOP and DHX9 mRNA levels by real-time PCR analysis after SPOP depletion in JAR cells (C) or JEG3 cells (D). (E and F) IB analysis of DHX9 and SPOP levels before and after adding MG132 to JAR cells (E) or JEG3 cells (F) transfected with the indicated constructs. (G) IB analysis of WCLs and anti-DHX9 co-IPs derived from JAR cells and 293T cells transfected with indicated constructs. Cells were treated with 10 μg/ml MG132 for 10 h before harvesting. Data are shown as mean ± SD of three independent experiments. NS, P>0.05, *P < 0.05, **P < 0.01, ***P < 0.001, ****P < 0.0001, Student’s t-test.

