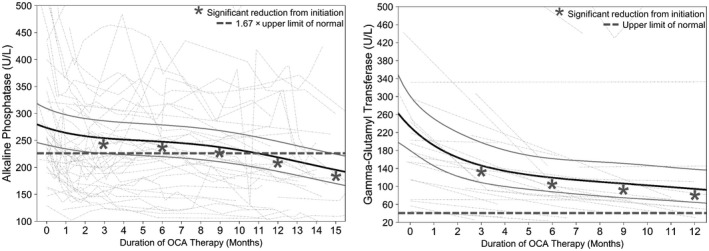
Fig. 2.

Estimated mean reductions in ALP and GGT from OCA initiation. The black solid line represents fixed effects, gray solid lines are 95% CI, and dotted lines are individual values of patients with at least two measurements. ALP and GGT at 3, 6, 9, and 12 months are reduced compared to initiation (P < 0.01 for all comparisons).
