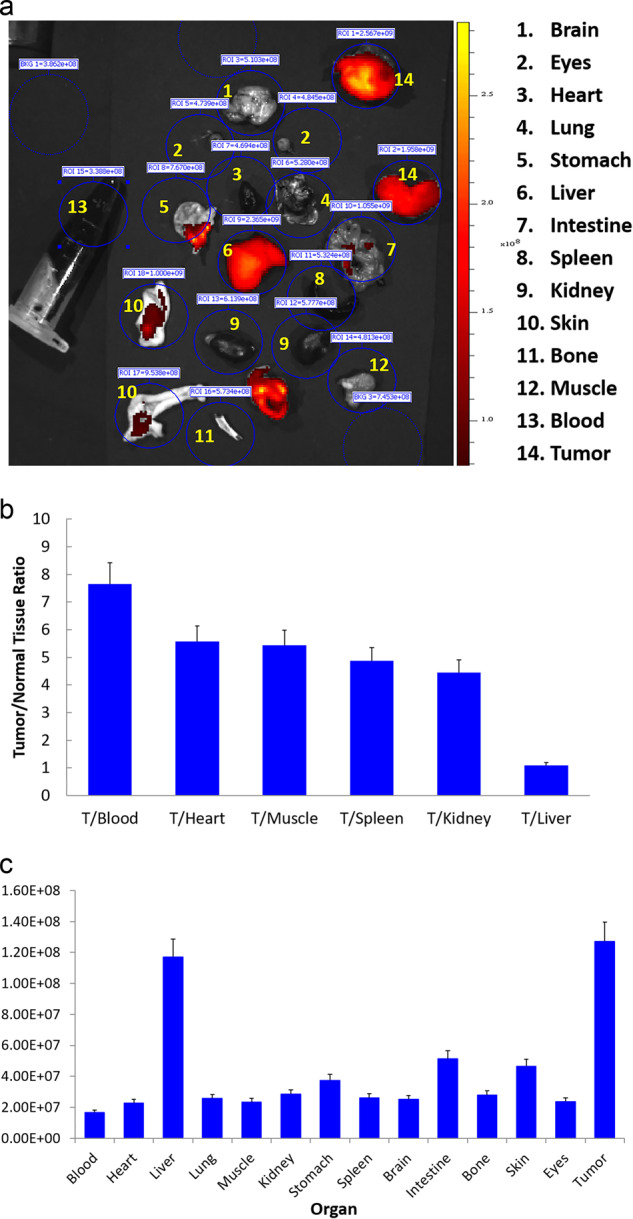
Fig. 5.

a Ex vivo imaging of tumor and normal tissues of Cy5.5-mAb109 at 48 h p.i. b Fluorescence intensity ratios of tumor-to-normal tissues based on the ROI analysis. (c) ROI analysis of fluorescent signal from tumor and normal tissues. Error bar was calculated as the standard deviation (n = 3)
