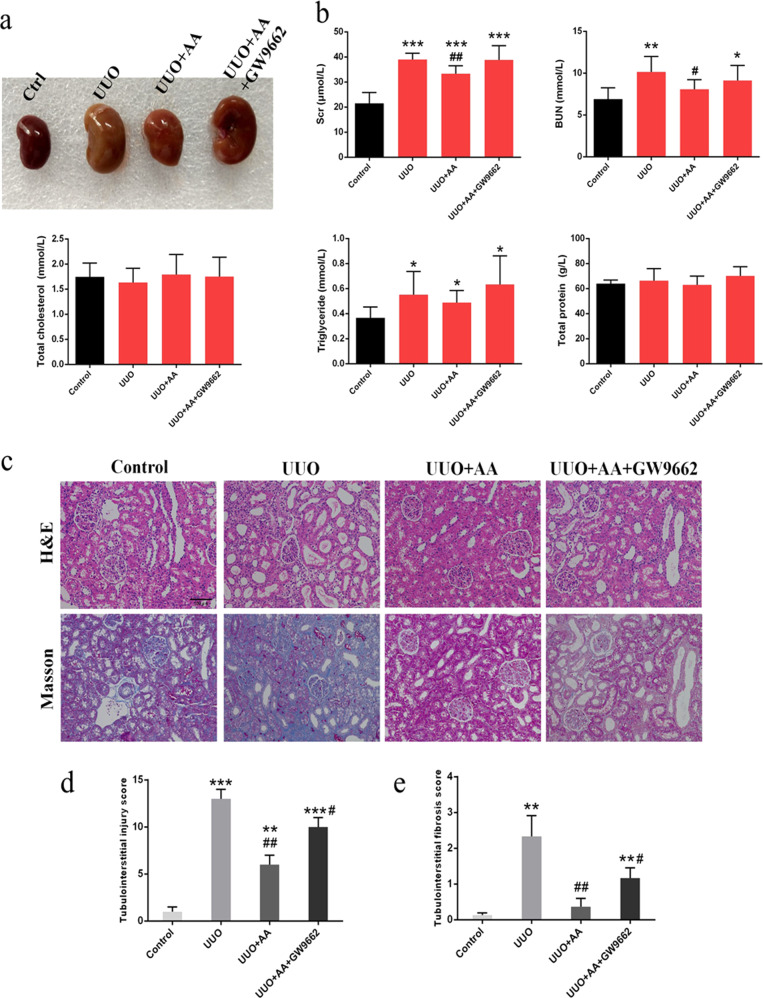
Fig. 1.
a Representative photographs of left kidneys. b Biochemical parameters including serum creatinine (Scr), blood urea nitrogen (BUN), total cholesterol (TC), triglyceride (TG), and total protein (TP) in each group. c Representative photomicrographs of the H&E staining and Masson’s trichrome staining from left kidneys of control, UUO, UUO + AA, UUO + AA + GW9662 rats. d Bar graph depicts renal injury scores based on H&E staining. e Bar graph depicts renal interstitial fibrosis scores based on Masson’s trichrome staining. (H&E staining; scale bar, 100 µm; Masson staining; scale bar, 50 µm; magnification, ×200). *P < 0.05, **P < 0.01, ***P < 0.001 (compared with control group); #P < 0.05, ##P < 0.01 (compared with UUO group)

