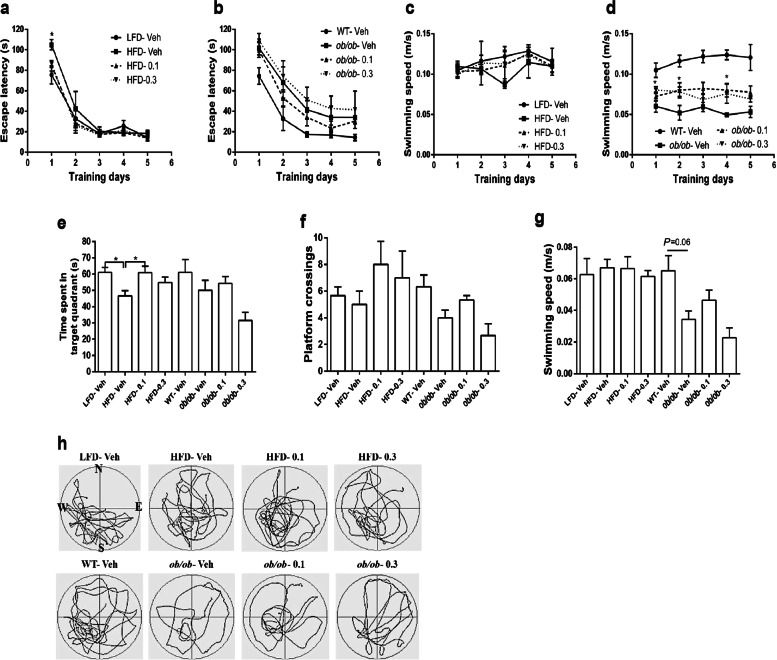
Fig. 3.
Morris water maze test in 11-month-old mice. a, b Plots exhibit the average escape latencies of mice for each training day (For day 1, HFD-Veh vs LFD-Veh: P = 0.0286; HFD-Veh vs HFD-0.1: P = 0.0278; HFD-Veh vs HFD-0.3:P = 0.0139). c, d Average speed during the training days. e Time spent in the platform-located quadrant during the probe test (n = 5 in each group). f, g Entries through the platform position and swimming speed during the probe test (n = 5 in each group). h Representative swim paths of mice during the probe test. Data are presented as the mean ± SEM. Data are compared using two-way ANOVA with Bonferroni post hoc test a–d and one-way ANOVA with Tukey post hoc test e–g. *P < 0.05

