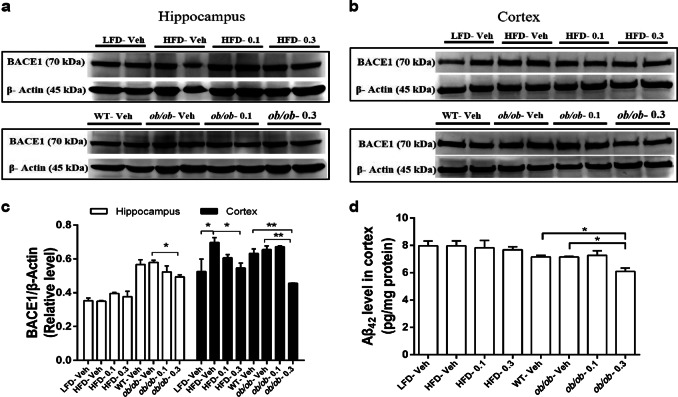
Fig. 5.
The effects of Hup A on BACE1 and Aβ42 levels in the hippocampus or cortex. a Western blot of BACE1 protein expression in the hippocampus of HFD and ob/ob mice. b Western blot of BACE1 protein expression in the cortex of HFD and ob/ob mice. c Quantification of BACE1/β-actin protein expression according to A and B (n = 5 in each group). d The level of Aβ42 in the cortex by ELISA (n = 4 in each group). Data are presented as the mean ± SEM. Data are compared using one-way ANOVA with Tukey’s post hoc test. *P < 0.05; **P < 0.01

