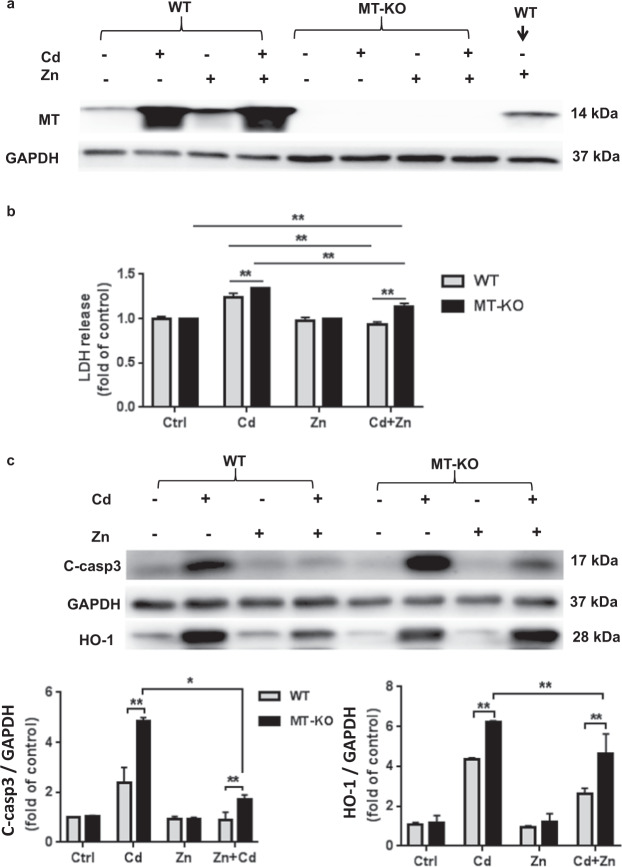
Fig. 4. MT plays a role in Zn protection from ECT Cd toxicity.
a MT expression in WT and in MT-KO ECTs following Zn (50 µM) and/or Cd (20 µM) for 24 h. b LDH release into media following Zn (50 µM) and/or Cd (20 µM) for 24 h. Group size ranged from n = 6–8 per group. c Cleaved caspase 3 and HO-1 expression in WT and MT-KO ECT in each treatment group (Ctrl; Cd; Zn; Zn + Cd). Group size is n = 4 per group. *P < 0.05 and **P < 0.01 vs. corresponding Ctrl ECT.

