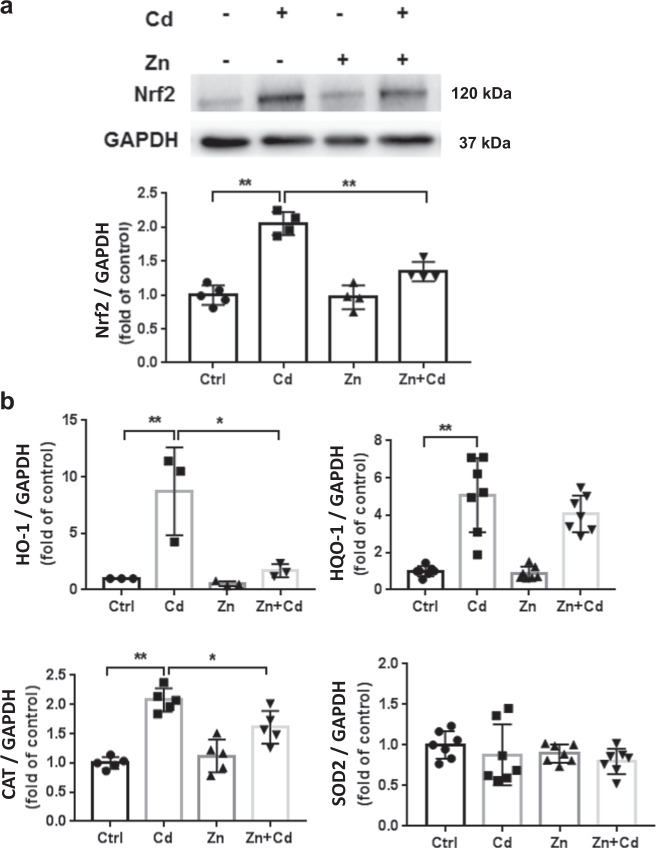
Fig. 5. Cd and Zn induce ECT Nrf2 and downstream genes.
a ECT Nrf2 following Zn (50 µM) and/or Cd (20 µM) for 24 h. Group size is n = 4 per group. b qPCR results of Nrf2 downstream genes (HO-1, NQO-1, CAT, SOD2) following Zn (50 µM) and/or Cd (20 µM) for 24 h. Group size ranged from n = 3–7 per group. *P < 0.05 vs. corresponding groups. **P < 0.01 vs. corresponding groups.

