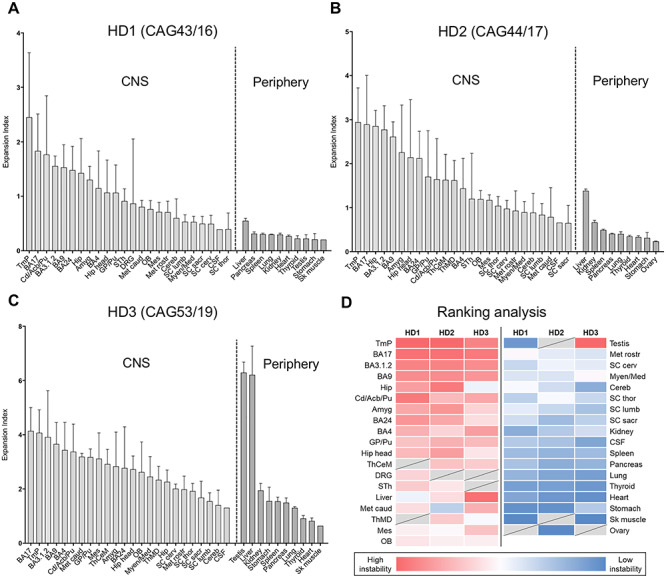
Figure 1.

Quantitative analyses of somatic CAG expansion in adult-onset HD. (A–D) Expansion indices were quantified from GeneMapper peak height data of HTT CAG PCR products from individuals HD1, HD2 and HD3, analyzed in Boston, USA. Bars show mean expansion indices for each tissue, and error bars show standard deviation between tissue sub-pieces. For each individual, data are plotted in order of mean tissue expansion index, separately for the CNS and periphery. (D) Mean expansion indices were ranked for each individual and ranks displayed as heat map. Tissues are displayed in order of mean rank. Dark red = most expanded; white = median; dark blue = least expanded; gray = tissue not available. OB, olfactory bulb; BA9, prefrontal cortex; BA24, anterior cingulate/midcingulate cortex; BA4, primary motor cortex; BA3.1.2, primary somatosensory cortex; Tmp, temporal pole; BA17, primary visual cortex; Cd/Acb/Pu, caudate/accumbens/putamen; GP/Pu, globus pallidus/putamen; ThCeM, centromedial thalamic nucleus; ThMD, dorsomedial thalamic nucleus; STh, subthalamic nucleus; Amyg, amygdala; Hip head, hippocampal formation (head); Hip, hippocampal formation; Mes, mesencephalon; Met rostr, metencephalon rostral; Met caud, metencephalon caudal; Myen/Med, myelencephalon/medulla; Cereb, cerebellum; SC cerv, spinal cord cervical; SC thor, spinal cord thoracic; SC lumb, spinal cord lumbar; SC sacr, spinal cord sacral; DRG, dorsal root ganglion; CSF, cerebrospinal fluid; Sk muscle, psoas skeletal muscle. Numbers of samples for each tissue are shown in Supplementary Material, Table S1.
