
Figure 3.
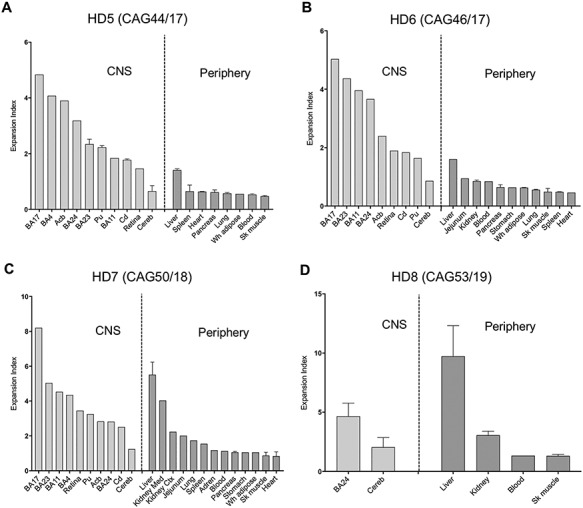
Quantitative somatic CAG expansion analyses of a replicate set of adult-onset HD tissues. (A-D) Expansion indices were quantified from GeneMapper peak height data of HTT CAG PCR products from individuals HD5, HD6, HD7 and HD8, analyzed in Bochum, Germany. Bars show mean expansion indices for each tissue, and error bars show standard deviation between tissue sub-pieces, other than HD5 blood where there are two technical PCR replicates of the same DNA sample. For each individual, data are plotted in order of mean tissue expansion index, separately for the brain and periphery. BA11, straight gyrus; BA24, anterior cingulate/midcingulate cortex; BA23, postcingulate cortex; BA4, primary motor cortex; BA3.1.2, primary somatosensory cortex; BA17, primary visual cortex; Cd, caudate; Acb, accumbens; Pu, putamen; Cereb, cerebellum; Kidney Med, kidney medulla; Kidney Ctx, kidney cortex; Sk muscle, sartorius or temporal skeletal muscle; Adren, adrenal gland; Wh adipose, white adipose tissue. Numbers of samples for each tissue are shown in Supplementary Material, Table S1.