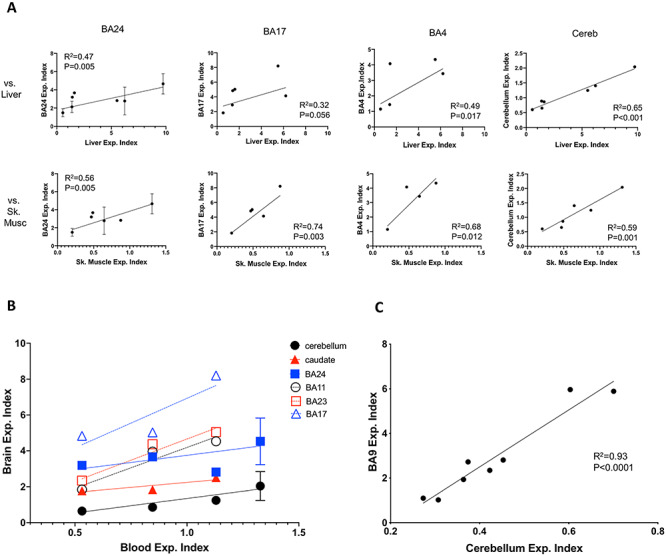
Figure 6.

Correlations between expansion indices in different tissues. (A) Correlation between expansion indices in liver (top panels) or skeletal muscle (lower panels) and those in BA24, BA17, BA4 and cerebellum across individuals HD1–3 and HD5–8. N = 4–7 depending on the tissue comparison (see Supplementary Material, Table S1). (B) Comparison of Expansion indices in brain regions and in blood from individuals HD5–8. For replicate measurements, mean ± SD is plotted. Sample number is too low (N = 4 or N = 3 depending on the brain region) for meaningful statistical analyses, however, results of linear regressions of brain region versus blood expansion indices, meant to indicate trends are as follows: cerebellum R2 = 0.72, P = 0.0086; caudate R2 = 0.80, P = 0.11; BA24 R2 = 0.22, P = 0.35; BA11 R2 = 0.92, P = 0.18, BA23 R2 = 0.95, P = 0.026; BA17 R2 = 0.77, P = 0.32. Trend lines are shown on the graphs. (C) Correlation between expansion indices in cortex (BA9) and cerebellum from an additional eight individuals (CAG 40–48).
