Figure 8.

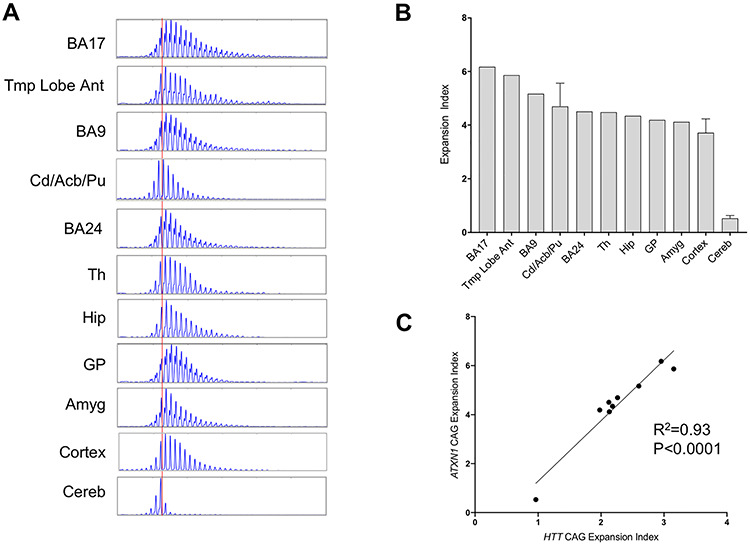
ATXN1 CAG expansion in brain tissues and correlation with HTT CAG expansion. (A) GeneMapper traces of ATXN1 CAG PCR products. The red vertical line shows the modal allele in cerebellum (CAG46). (B) Expansion indices calculated from GeneMapper peak height data of expanded allele ATXN1 CAG repeats. Three tissue pieces were analyzed for caudate/accumbens/putamen, cortex and cerebellum and bars show mean ± SD. BA9, prefrontal cortex; BA24, anterior cingulate/midcingulate cortex; Tmp Lobe Ant, anterior temporal lobe; BA17, primary visual cortex; Cd/Acb/Pu, caudate/accumbens/putamen; Th, thalamus; Hip: hippocampal formation; GP, globus pallidus; Amyg, amygdala; Cereb, cerebellum. (C) Correlation between mean ATXN1 and mean HTT CAG expansion indices (individuals HD1, HD2, HD3) for the shared tissues. Shared tissues used in the correlation are temporal pole (HD)/anterior temporal lobe (SCA1), BA17, caudate/accumbens/putamen, BA9, BA24, hippocampal formation, amygdala, globus pallidus/putamen (HD)/globus pallidus (SCA1) and cerebellum.
