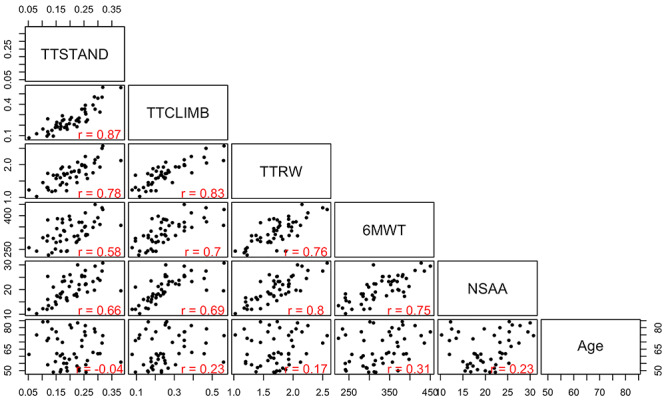
Figure 1.

Scatterplot matrix of timed function tests, 6MWT, NSAA and age. Shown is mean of four measures over ~6-week time frame for 48 DMD subjects (4 to <7 years, steroid-naïve). The first three motor outcomes, TTSTAND, TTCLIMB and TTRW, are quantified in velocity units, 6MWT in meters, NSAA out of a maximum of 34 and age in months. Pearson correlations are also provided. The figure in the first column, second row, represents a scatterplot of time to stand (x-axis) versus time to climb (y-axis).
