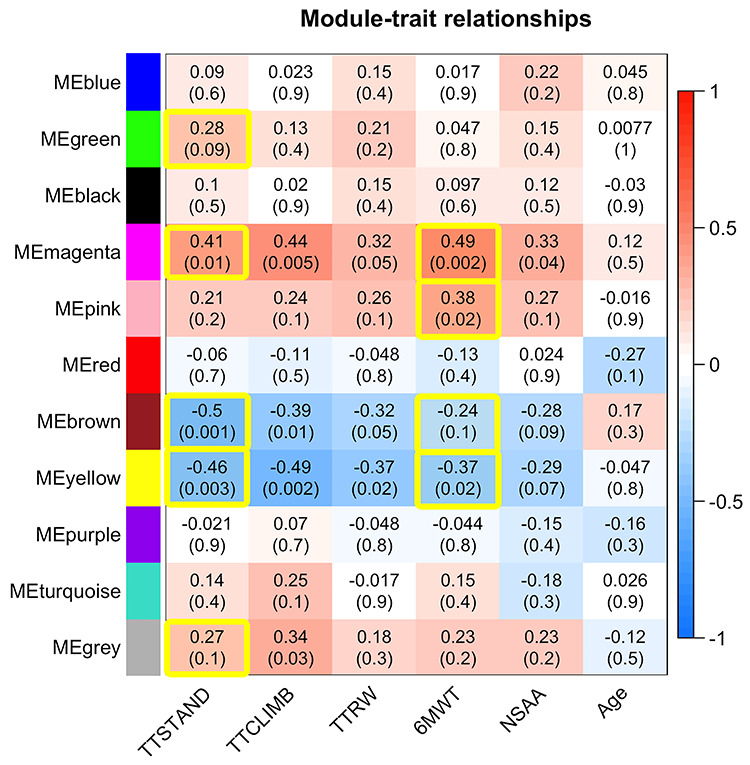
Figure 3.

Screening step showing module trait relationships between motor outcomes and modules of serum proteins. Correlations of 11 MEs for clusters of proteins with clinical outcomes. Pearson correlations and associated P-values in parenthesis are provided. P-values were not adjusted for multiple testing in this screening step. The yellow-highlighted cells were those carried forward for statistical model building for TTSTAND and 6MWT.
