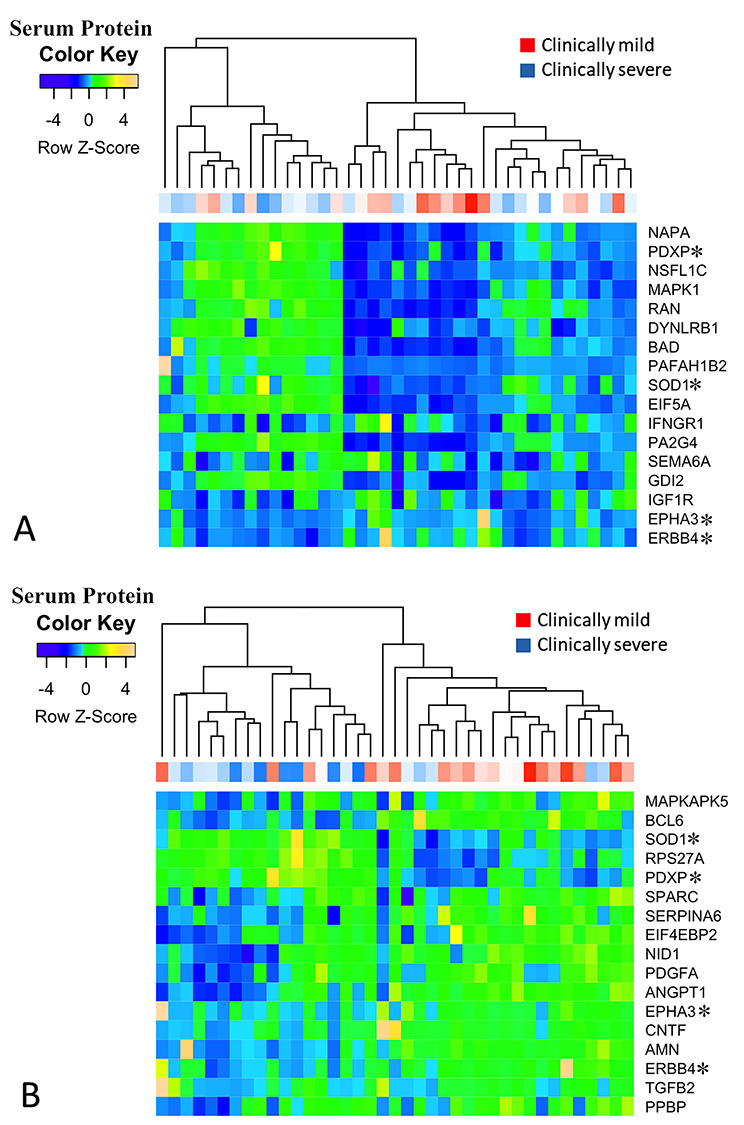
Figure 4.

Clustering of serum proteins identified as associated with more affected phenotypes as determined by the outcome measures TTSTAND (A) and 6MWT (B) using unsupervised clustering. Patient-level clinical severity data is shown on the x-axis and serum protein levels on the y-axis. TTSTAND shows a clustering of clinically milder patients (red) in the center of dendrogram, corresponding to lower levels of most serum proteins from the model. 6MWT shows a clustering of clinically milder patients to the right of the dendrogram, corresponding to higher levels of most serum proteins in the model. Proteins marked with an asterisk are shared between the two clinical outcome models and demonstrate similar behavior in both models.
