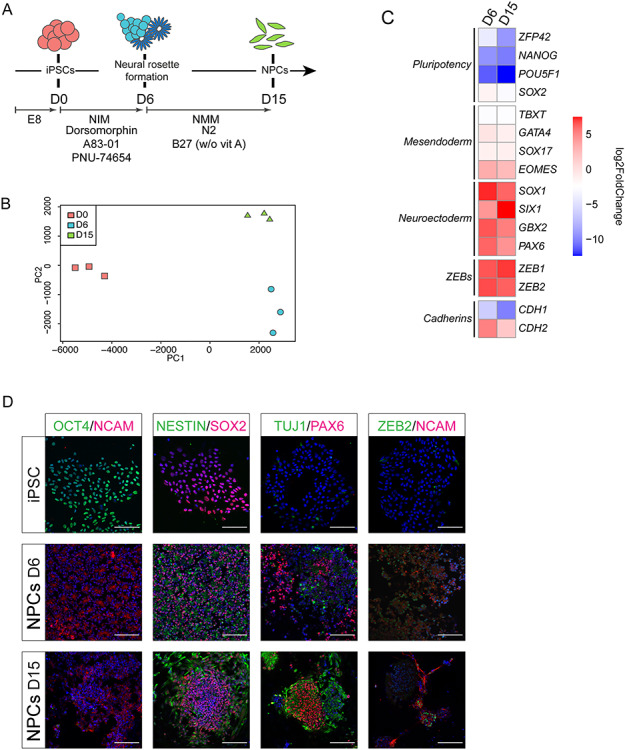
Figure 1.

Gene expression profiling of differentiating iPSCs. (A) Schematic overview of the differentiation protocol used, including specific media and inhibitors (see Materials and Methods). Abbreviations used: EB, embryoid body; NIM, neural induction medium; D (day) 0, undifferentiated state; D6, early NPC/neural rosette formation; D15, NPCs; w/o vit A, no vitamin A added to B27. (B) Principal component analysis plot showing clustering of biological repeat (n = 3) RNA-seq samples based on time of differentiation. (C) log2Fold Change heatmap of selected marker genes confirming progression from pluripotency to efficient neural differentiation. (D) Immunofluorescence staining at selected timepoints of differentiation for pluripotency (OCT4, SOX2) and NPC markers (NCAM, NESTIN, TUJ1 and PAX6) and ZEB2. Scale bar = 100 μm.
