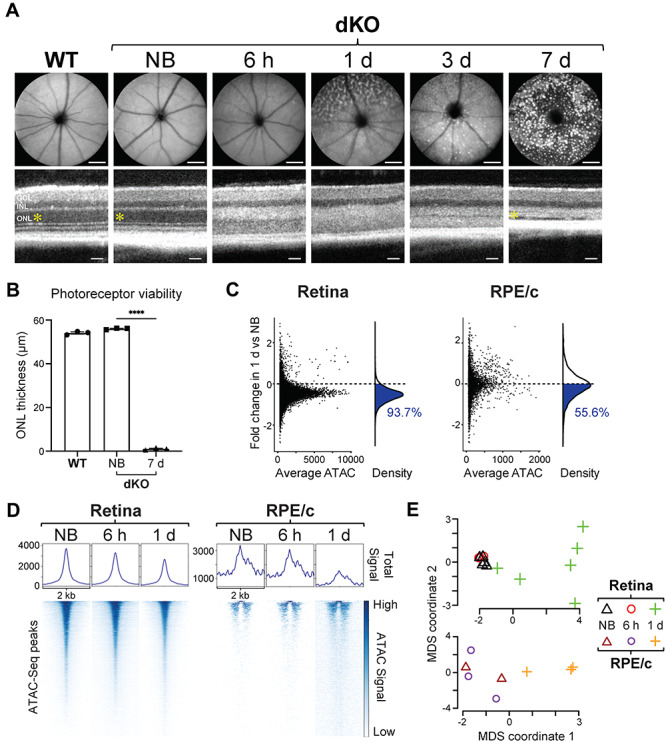
Figure 2.

Chromatin accessibility changes in a light-damaged retina. (A) SLO images (top) demonstrate the time course of induction of retinal pathology (autofluorescent spots) in the fundus of photosensitive Abca4−/−Rdh8−/− (dKO) mice 6 h to 1/3/7 days after exposure to bright light stress, as compared to non-bleached (NB) dKO and wild-type (WT) mice. SLO scale bars, 1 mm. OCT images (bottom) were also obtained from these mice, and the thickness of the photoreceptor-containing outer nuclear layer (ONL; yellow asterisk) is quantified in (B), exhibiting complete degeneration in the dKO mice by 7 days post-bleach. OCT scale bars, 50 μm. INL, inner nuclear layer; GCL, ganglion cell layer. n = 3 per group. (C) Global decrease of chromatin accessibility in the retina and RPE/choroid (RPE/c) 1 day after photobleaching relative to non-bleached dKO mice. Each data point (left panel) represents one ATAC-Seq peak, and the population of reduced peaks is highlighted in blue in the density curve (right panel) and quantified as a percentage of all ATAC-Seq peaks. (D) Global heat map of open chromatin regions in non-bleached dKO mice, compared to 6 h and 1 day after bright light exposure. Each row (bottom panel) represents one ATAC-Seq peak, and the degree of chromatin accessibility is represented by color. Peaks are aligned at the center of regions spanning 2 kb. The total ATAC-Seq signal (normalized counts) of all peaks combined is shown in the top panel. (E) Multidimensional scaling (MDS) of all retina and RPE/choroid samples. Non-bleached (n = 5 for retina, n = 2 for RPE/c) and bleached dKO mice 6 h (n = 3 for retina, n = 3 for RPE/c) and 1 day (n = 6 for retina, n = 3 for RPE/c) after light exposure cluster into groups with distinct ATAC-Seq profiles.
