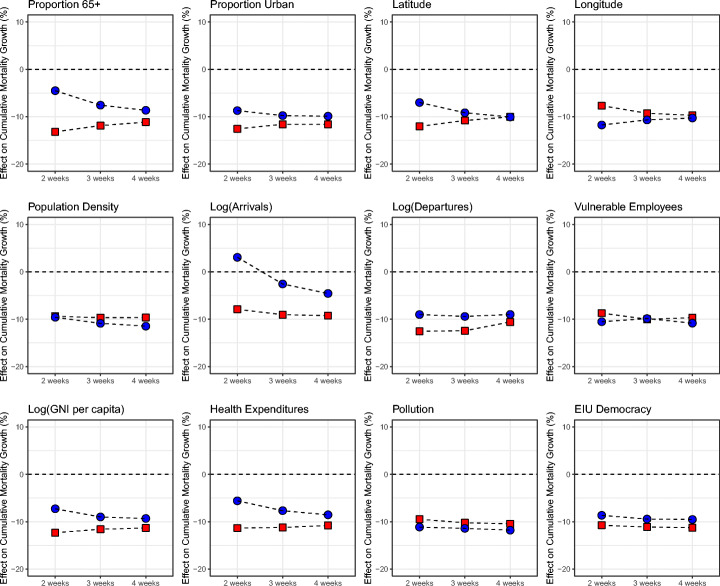
Fig. 10.
Cumulative mortality growth impacts: government response, demographics, geography, and development level. Note: Results of panel analysis on cumulative mortality growth rates. Red squares (blue circles) represent the local projection impact from a 10-unit higher stringency index on mortality growth for countries in the 75th percentile (25th percentile) of the country characteristic

