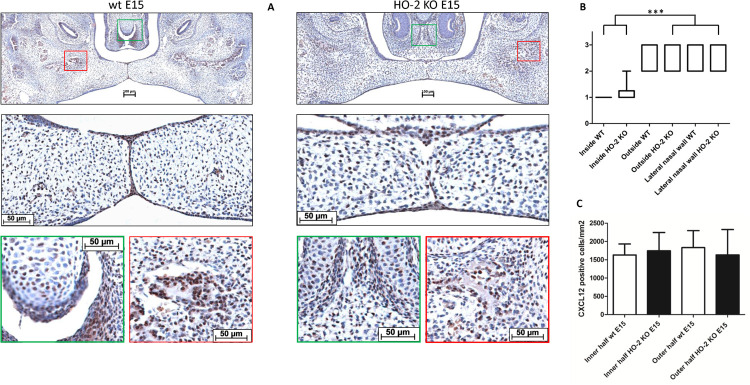
FIGURE 11.
CXCL12 expression in the MES and palatal osteogenic centers. (A) Upper panel: Coronal palatal section stained for CXCL12 expression, representative for the wt and HO-2 KO fetuses. Middle panel: Magnification of the central part of the fusing palate including the MES. The MES demonstrated strong CXCL12 expression. CXCL12-positive cells were also found in the palatal mesenchyme. Green panel: The osteogenic centers at the lateral/oral side of the nasal septum demonstrated clusters of strong CXCL12 expressing cells. Also in the cartilage of the forming nasal septum CXCL12 expressing cells were present. Red panel: The osteogenic centers in the lateral parts of the fusing palate demonstrated clusters of strong CXCL12 expressing cells. (B) Box-and-whisker plot with 10–90 percentiles of semi-quantitative assessment of the CXCL12 expression in the palatal epithelial layers (scoring scale in three categories: 1 = HIGH, 2 = MODERATE and 3 = LOW) compared for the different regions in sections from wt E15 (n = 7) and HO-2 KO E15 fetuses (n = 10), ∗∗∗ = p < 0.001. (C) Bar chart of the number of mesenchymal CXCL12-positive cells cells/mm2 compared for the wt E15 (n = 7) and HO-2 KO E15 fetuses (n = 10) between the outline of the inner and outer half of the mesenchyme. Data are shown as mean ± SD. No statistically significant differences in CXCL12 expression were found (p = 0.85).

