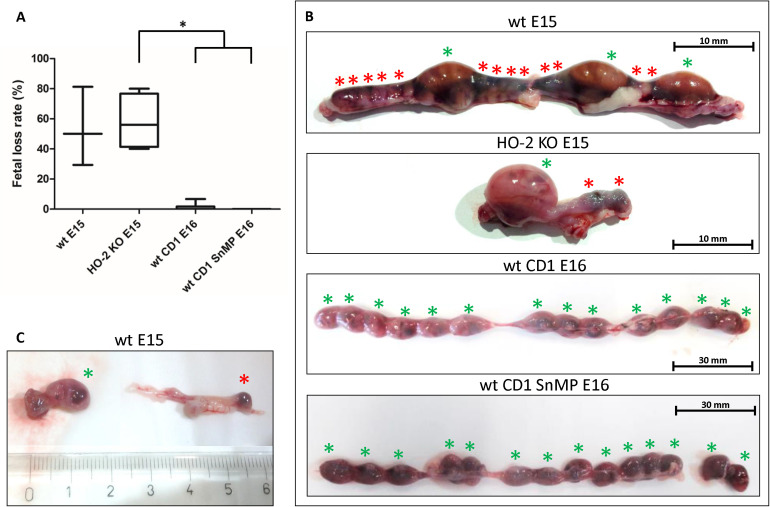
FIGURE 12.
Fetal resorption independent of HO-2 KO expression and HO-activity. (A) Box-and-whisker plot with 10–90 percentiles of quantitative assessment of the fetal loss ratio in the wt (n = 3) and HO-2 KO pregnant mice (n = 4) at E15, and wt CD1 mice (n = 6) and wt CD1 SnMP mice (n = 4) at E16, ∗p < 0.05. (B) The uteri were photographed, the green asterisk indicated a fetus, the red asterisk indicated a fetal resorption. Representative uterus per group was shown. (C) Isolated fetus with placenta and isolated fetal resorption from the uterus.

