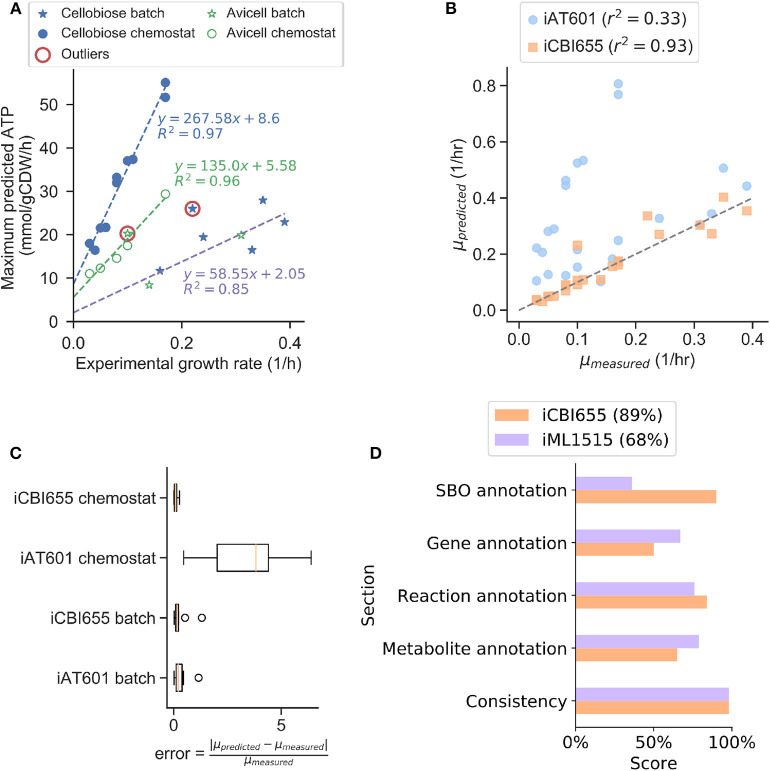
Figure 1.
Training and validation of the iCBI655 model. (A) Training of GAM and NGAM parameters. Discrete points correspond to experimental data. The slope of the linear regression function corresponds to GAM, while the intercept corresponds to NGAM. The data points circled as outliers were not included in any of the linear regression calculations. (B) Comparison of growth prediction error between iCBI655 and iAT601. Each maximum growth rate was predicted by constraining the models with the measured substrate uptake and product secretion fluxes (Supplementary Datasheet 2). r2 corresponds to the Pearson correlation coefficient. (C) Error in growth predictions under batch and chemostat conditions. Predicted and measured growth rates correspond to the values included in (B). (D) Scores provided by the quality control tool Memote (Lieven et al., 2020) for iCBI655 and iML1515. “Overall score” is shown in the legend.

