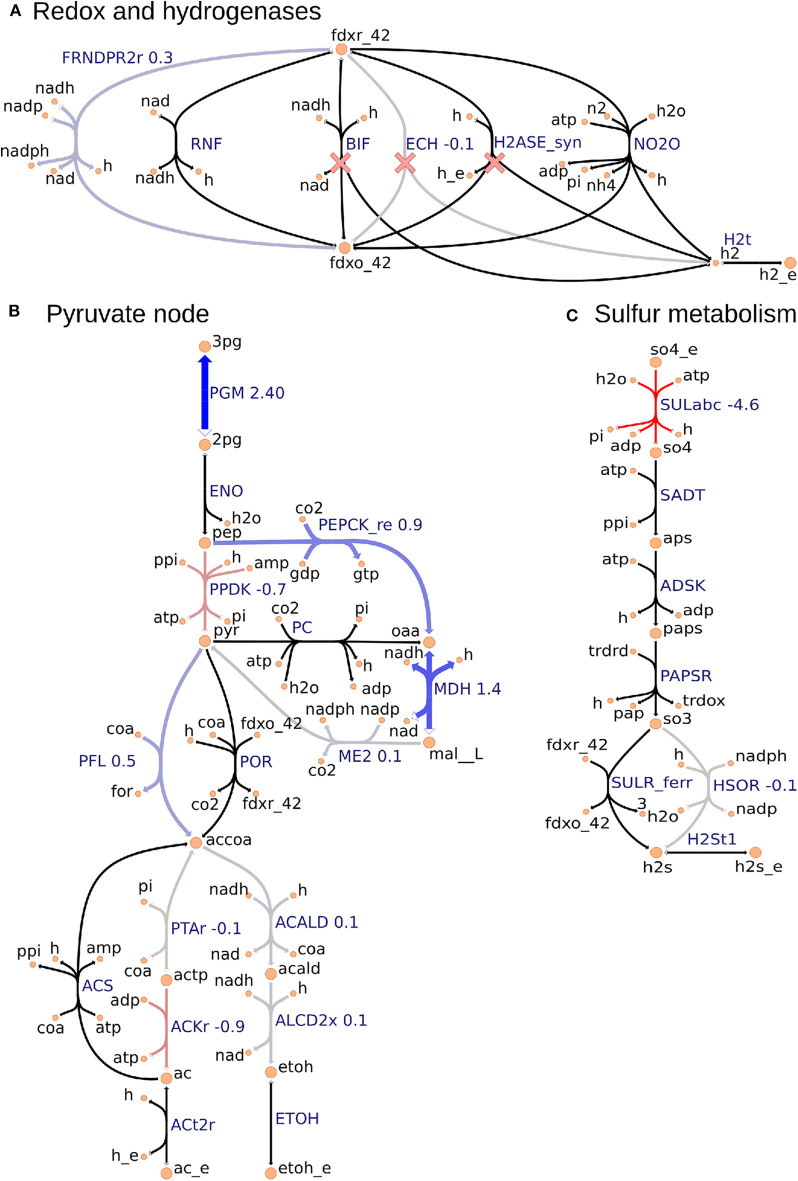
Figure 3.
Metabolic map visualization for (A) redox and hydrogenases pathway, (B) pyruvate node that links glycolysis, incomplete Krebs cycle, anapleurotic pathway, and fermentative pathway, and (C) sulfur metabolism using the Escher tool. Values next to reaction labels correspond to proteomics fold change between the ΔhydGΔech and wild-type strains only for the 70 consistent reactions identified by using the FC-based omics integration protocol (section 2.5). The labels of extracellular metabolites are appended with “_e.” Reactions marked with a red cross are deleted in ΔhydGΔech.

