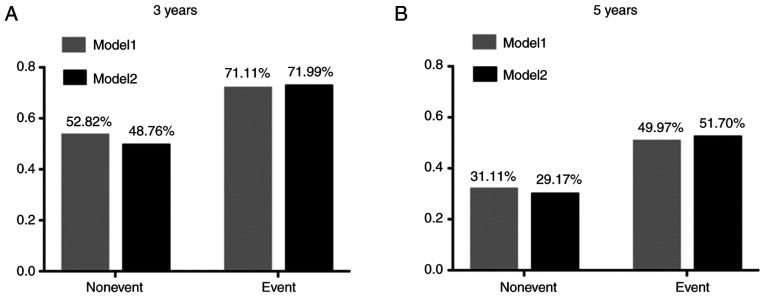
Figure 5.
Prediction model IDI analysis. (A) IDI analysis of prediction model predicting 3-year survival rate. (B) IDI analysis of prediction model predicting 5-year survival rate. The Y axis is the average value of the disease occurrence probability predicted by the model for each individual. IDI, integrated discriminant improvement.

