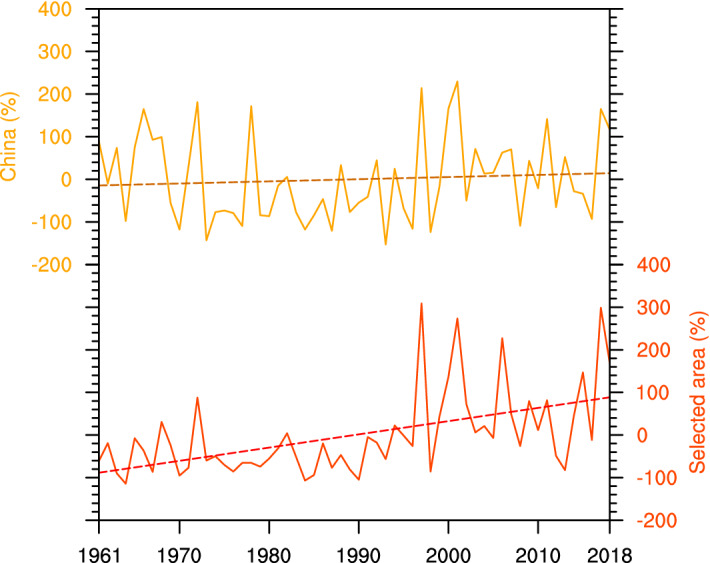
Figure 3.

Normalized time series of the annual number of CDHE days in China (brown line) and in the selected area (stations with increase trends in CDHE days, mainly in Southwest China, eastern Northwest China, northern North China and coastal area of southeastern China, red line) in warm season during 1961–2018, respectively. The map is generated using NCAR Command Language (The NCAR Command Language (Version 6.6.2) [Software]. (2019). Boulder, Colorado: UCAR/NCAR/CISL/TDD. https://www.ncl.ucar.edu/).
