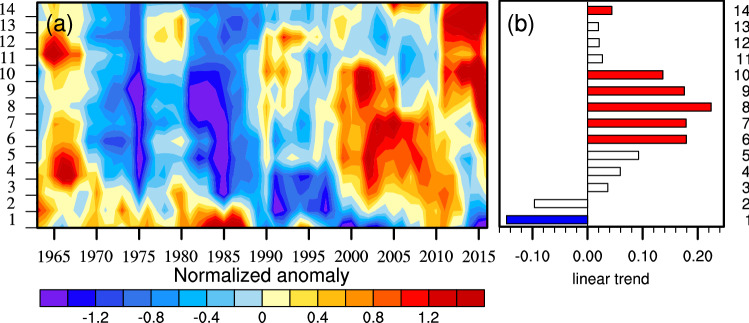
Figure 5.
(a) temporal evolution of normalized anomaly of the fractional contribution of CDHEs with different duration to the total number of CDHE days for stations in China in warm season smoothed with a 5-year running mean, and (b) trend (%/10a) in the normalized anomaly of the fractional contribution of CDHEs with different duration during the period of 1961–2018 (Filled bars stand for the station with statistical significance at 90% confidence level). Maps are generated using NCAR Command Language (The NCAR Command Language (Version 6.6.2) [Software]. (2019). Boulder, Colorado: UCAR/NCAR/CISL/TDD. https://www.ncl.ucar.edu/).

