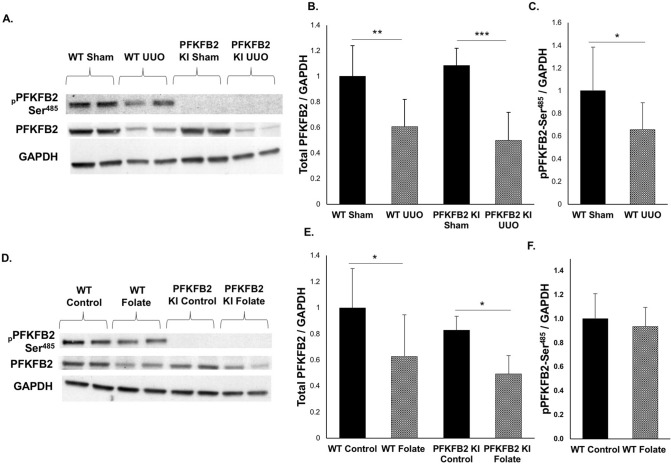
Figure 5.
PFKFB2 and pPFKFB2 expression in WT mice and PFKFB2 KI mice with UUO and FAN. (A,B) Representative Western blots showing significantly reduced expression of PFKFB2 in WT and PFKFB2 KI mice with UUO, as determined by densitometry. There was, however, no difference between WT and PFKFB2 KI mice. (C) pPFKFB2-Ser485 was reduced in WT mice with UUO when normalized to GAPDH, although consistent with the reduced level of expression of PFKFB2. (D,E) Representative Western blots showing significantly reduced expression of PFKFB2 in WT and PFKFB2 KI mice with FAN, as determined by densitometry. Again, there was no difference between WT and PFKFB2 KI mice. (F) pPFKFB2-Ser485 was unchanged in WT mice with FAN when normalized to GAPDH. n = 6 mice per panel. *P < 0.05, **P < 0.01, ***P < 0.001. Mean + S.D.

