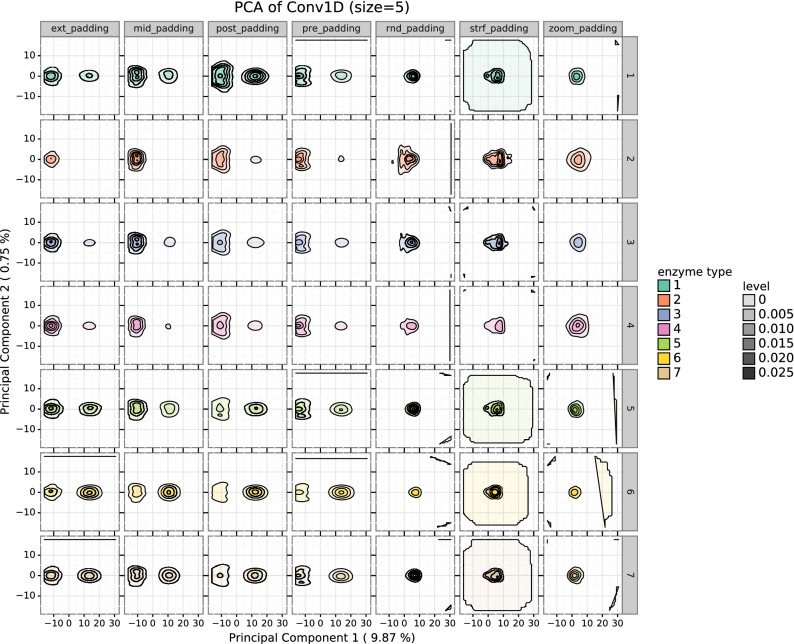
Figure 3.
Density representation of the PCA of the activations of the convolutional layer. Figure shows PC1 vs PC2 of the activations of the 1D Convolutional layer for the 1_conv model in task 2, for the 10 folds. This representation comes from applying a PCA to the convolutional filter activations after the prediction of 14 enzymatic sequences of different EC number using each padding type. Then, the graphical representation was stratified by padding and enzyme type. We can see that according to the structure of the distributions, there seems to be two different groups of enzymes: 2, 3, 4 and 1, 5, 6, 7. Regarding types of padding, the activations for dense paddings are similar between them (two clusters separated along PC1) and different from sparse paddings.

