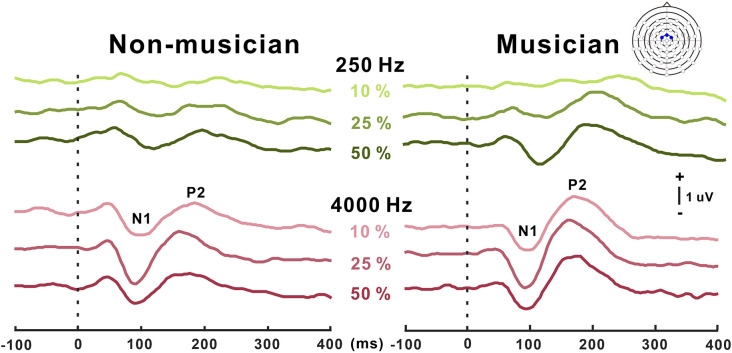
Figure 3.
Grand average N1/P2 responses to frequency changes. N1/P2 cortical potentials to frequency change stimuli in non-musicians (left) and musicians (right). Green and red color waveforms represent cortical responses for 250 and 4,000 Hz base frequencies, respectively. The amount of frequency change is indicated as a percentage. In the top right, a figure shows an equidistant cap layout indicating the frontal central electrodes (blue dots).

