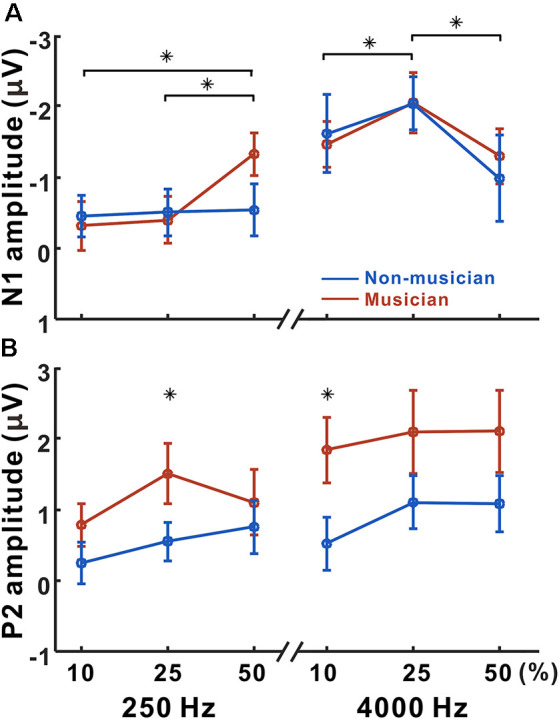
Figure 4.

Mean N1 and P2 amplitudes as a function of frequency change. Mean of N1 (A) and P2 (B) amplitudes in musicians and non-musicians are shown. Note that significant differences among listening conditions are revealed for the N1 (250 Hz: 10 vs. 50, 25 vs. 50%, 4,000 Hz: 10 vs. 25, 25 vs. 50%), whereas the differences between musicians and non-musicians are found for the P2 amplitude (250 Hz: 25%, 4,000 Hz: 10%). Asterisks (*) indicate significant differences (p < 0.05).
