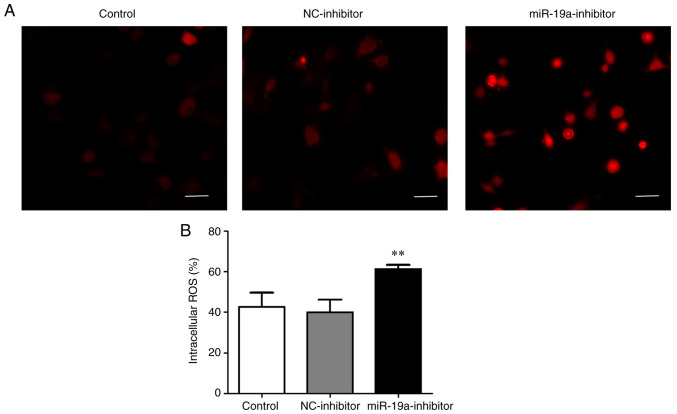
Figure 4.
ROS level in the control, NC-inhibitor and miR-19a-inhibitor groups as determined by DCFH-DA. (A) Representative images of ROS levels detected by DCFH-DA. (B) Statistical analysis of the ROS levels in each group. The content of ROS in the miR-19a-inhibitor group was significantly higher than that in the control and NC-inhibitor groups. **P<0.01 vs. the NC-inhibitor group. ROS, reactive oxygen species; NC, negative control.

