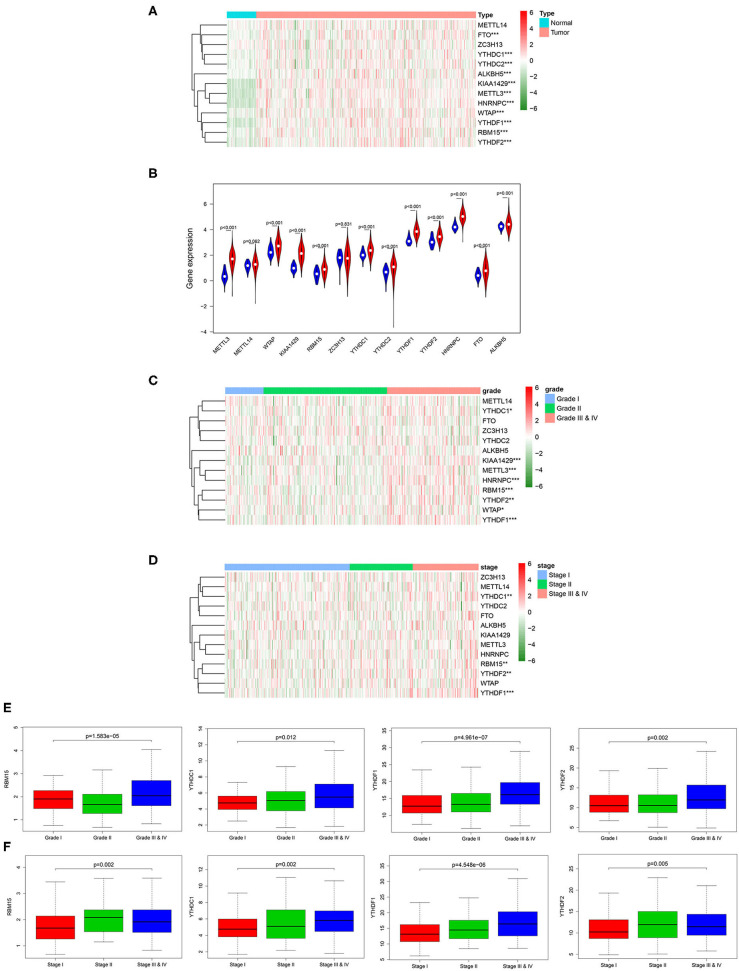
Figure 1.
Relationship between the expression of m6A RNA methylation regulatory factors and clinicopathological features in HCC. (A) Heat map shows the expression of the 13 m6A methylation regulatory factors in tumor group and normal group. (B) The violin plot exhibits the expression of the 13 m6A methylation regulatory factors in tumor group (red) and normal group (blue). (C,D) Heat maps of 13 m6A methylation regulatory factors in different grades and stages. (E,F) Boxplots display the expression of RBM15, YTHDC1, YTHDF1 and YTHDF2 in different grades and stages. ***p < 0.001, **p < 0.01, *p < 0.05.

