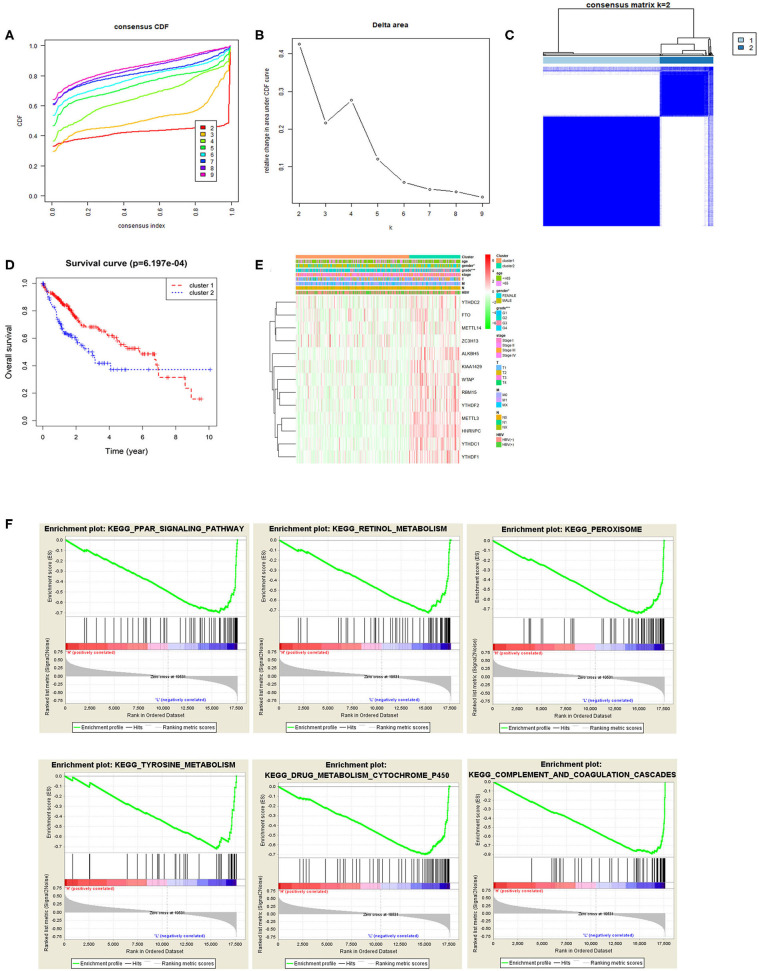
Figure 2.
Relationship between m6A methylation regulatory factors and the malignant progression of tumor. (A,B) Cumulative distribution function (CDF) of consensus clustering analysis, and the relative change in the area under the CDF curves when k = 2–9. (C) The samples were divided into cluster1 and cluster2 when k = 2, with a high intra-group correlation and a low or no significant intergroup correlation. (D) The Kaplan-Meier curves show the OS of patients in the two groups. (E) Heat map displays the difference in the expression of m6A methylation regulatory factors and the difference in clinicopathological features between the two groups. (F) KEGG enrichment analysis on the m6A methylation regulatory factors in the two groups.

