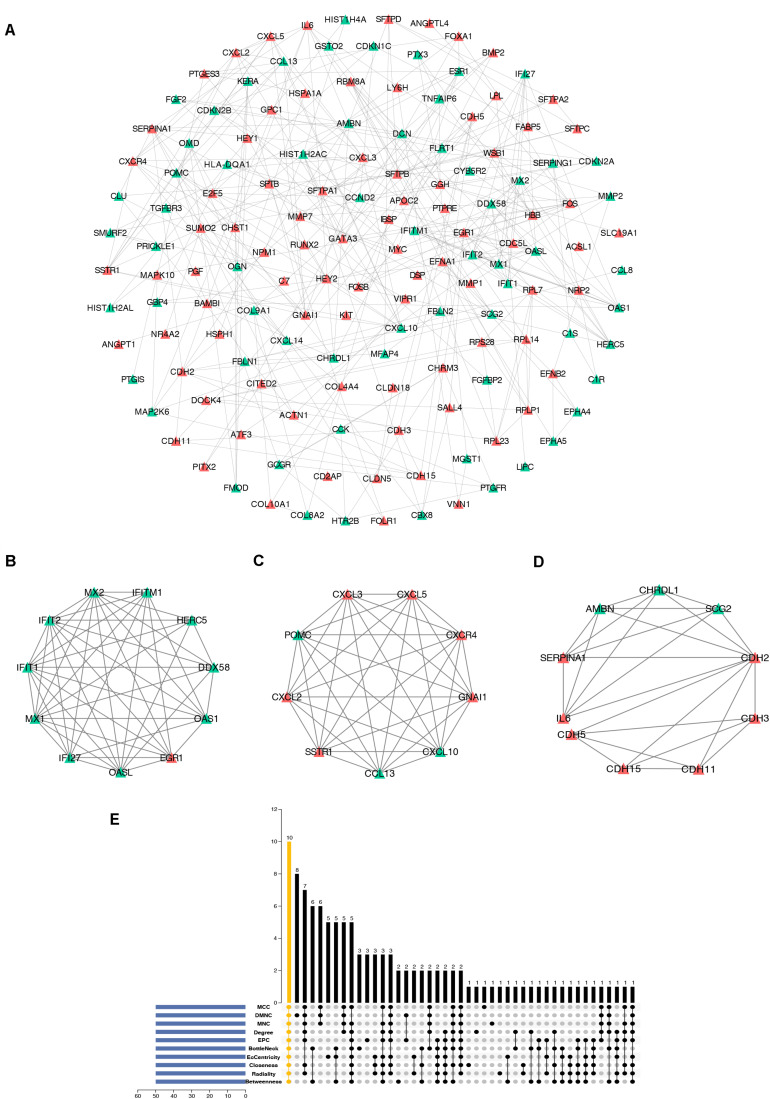
FIGURE 5.
Construction of PPI network, analysis of key modules, and identification of hub genes. (A) The whole PPI network. Upregulated genes are marked in red, while the downregulated genes are marked in green. (B) PPI network of module 1. (C) PPI network of module 2. (D) PPI network of module 3. (E) Hub genes were identified by intersection of 50 genes from 10 algorithms including MCC, DMNC, MNC, Degree, EPC, BottleNeck, EcCentricity, Closeness, Radiality, and Betweenness. PPI, protein–protein interaction.

