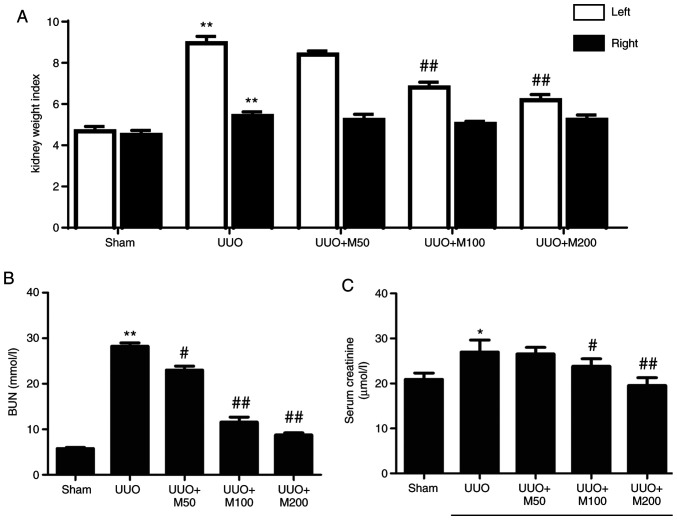
Figure 3.
Effect of metformin on hypertrophy of kidney and renal function. Kidney weight index (mg/g) was expressed as the ratio of final kidney weight (mg) to final body weight (g). (A) Statistical analysis of kidney weight index. (B) Statistical analysis of BUN. (C) Statistical analysis of serum creatinine. All data are presented as the mean ± SEM. n=6. *P<0.05, **P<0.01 vs. sham group; #P<0.05, ##P<0.01 vs. UUO group. Sham, Sham-operated group; UUO, unilateral ureteral obstruction group; UUO + M50, UUO rats treated with low-dose metformin, 50 mg/kg/day; UUO + M100, UUO rats treated with intermediate-dose metformin, 100 mg/kg/day; UUO + M200, UUO rats treated with high-dose metformin, 200 mg/kg/day; BUN, blood urea nitrogen.

