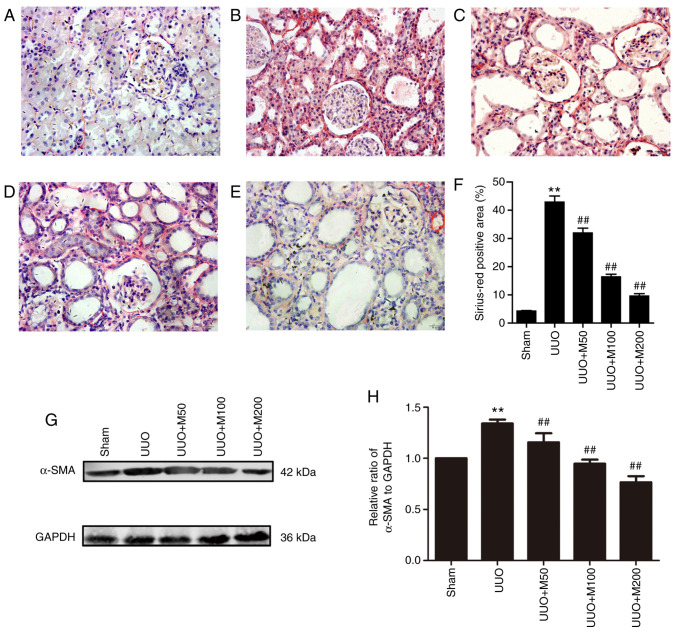
Figure 5.
Effect of metformin on collagen expression and α-SMA in obstructed kidney. (A) Sham operation. (B) UUO rats. (C) UUO rats treated with low-concentration metformin, 50 mg/kg/day. (D) UUO rats treated with medium-concentration metformin, 100 mg/kg/day. (E) UUO rats treated with high-concentration metformin, 200 mg/kg/day. (F) Statistical analysis of Sirius-Red positive area. Magnification, x400. n=6. (G) Protein expression level of α-SMA in the kidneys of rats was analyzed by western blotting. (H) Statistical analysis of α-SMA expression level. n=3. All data are presented as the mean ± SEM. **P<0.01 vs. sham group; ##P<0.01 vs. UUO group. UUO, unilateral ureteral obstruction; α-SMA, α-smooth muscle actin.

