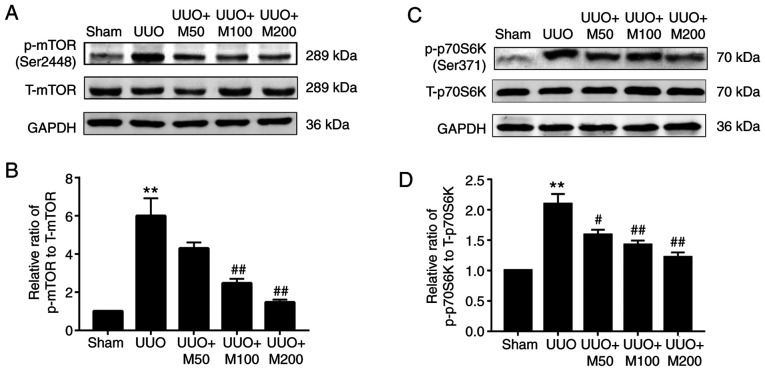
Figure 7.
Effect of metformin on the mTOR/p70S6K pathway in obstructed kidneys. Western blot and quantitative analysis of the levels of p-mTOR (Ser2448) and p- p70S6K (Ser371) was performed following normalization to T-mTOR and T-p70S6K, respectively. GAPDH was used as an internal control. (A) p-mTOR levels were detected in rat kidneys by western blotting. (B) Statistical analysis of the levels of p-mTOR. (C) p-p70S6K levels were detected in rat kidneys by western blotting. (D) Statistical analysis of the levels of p-p70S6K. All data are presented as the mean ± SEM. n=3. **P<0.01 vs. sham group; #P<0.05, ##P<0.01 vs. UUO group. Sham, Sham-operated group; UUO, unilateral ureteral obstruction group; UUO + M50, UUO rats treated with low-dose metformin, 50 mg/kg/day; UUO + M100, UUO rats treated with intermediate-dose metformin, 100 mg/kg/day; UUO + M200, UUO rats treated with high-dose metformin, 200 mg/kg/day; p-, phosphorylated; T-, total; p70S6K, ribosomal protein S6 kinase.

