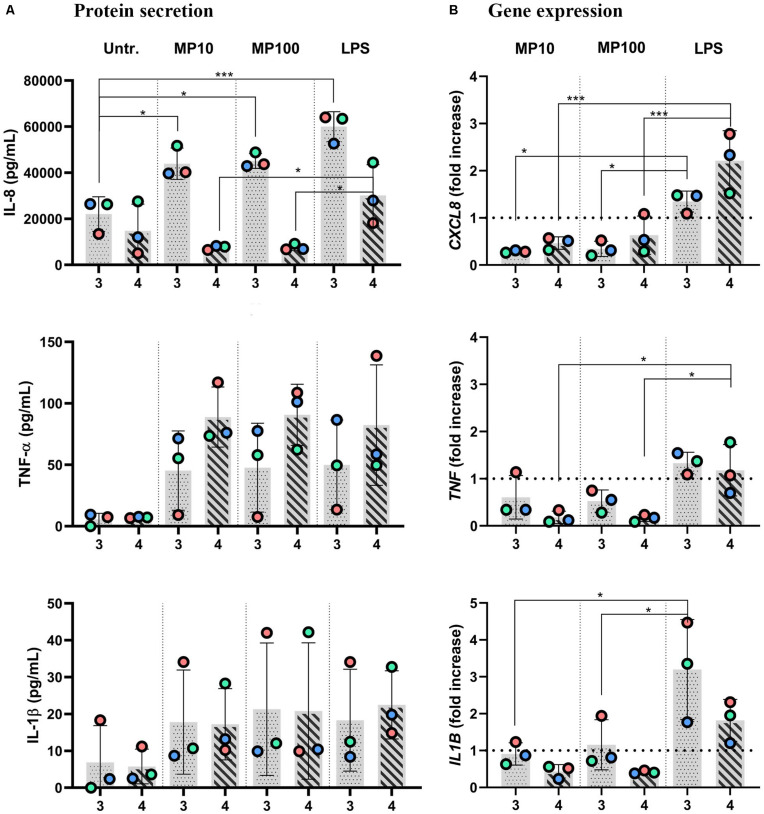
FIGURE 6.
Anti-inflammatory reactions after addition of MP to inflamed multicellular models upon removal of LPS. The x-axis represents the number of the approach applied: approaches 3 and 4. Inflamed models were triggered with LPS from the basal compartment (approach 3) or both sides (approach 4) for 24 h. Then, either LPS was removed from the apical side with the cRPMI left in during the apical MP treatment (approach 3) or cRPMI was removed, and inserts were thoroughly washed before MP application (approach 4) for an additional 24 h, at 10 or 100 μM MP. (A) Secretion of pro-inflammatory mediators IL-8, TNF-α, and IL-1β and (B) the respective gene expressions. The data of protein secretion is shown in pg/mL, measured in the basal compartment via ELISA. The data on gene expression, assessed via real-time RT-qPCR, is shown as fold increase of mRNA calculated via the ΔΔCt method, i.e., normalized to the expression of the housekeeping gene GAPDH and the expression of the gene of interest in the untreated samples. The dotted lines denote the mean value of untreated cells. Statistical analysis for ELISA was performed on pg/mL values using One-way ANOVA (Tukey’s post hoc; α = 0.05). For gene expression, statistically significant differences to untreated cells are shown. *p ≤ 0.05; **p ≤ 0.01; ***p ≤ 0.001. Abbreviations: Untr., untreated models; MP10 and MP100, models treated with LPS (24 h) followed by methylprednisolone at 10 or 100 μM for additional 24 h; LPS, positive control models, i.e., treated with LPS for 24 h, then washed accordingly and treated with the vehicle instead of MP.

