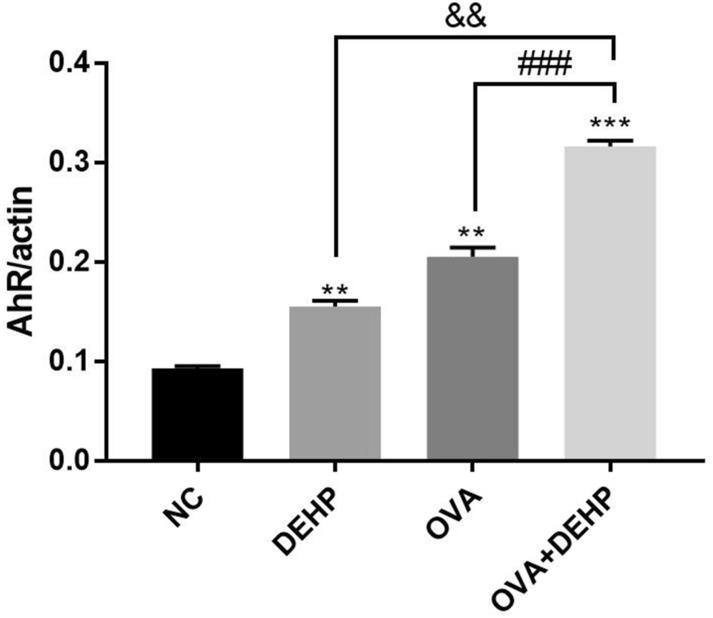
Figure 7.

The mRNA expression levels of AhR was measured by qRT-PCR analysis. The expression levels of mRNA were normalized to actin and given as fold induction compared to the mRNA level in control cells. All data are presented as the mean ± SD, (n = 6), *p < 0.05, **p < 0.01, ***p < 0.005, compared with the saline control; &p < 0.05, &&p < 0.01, &&&p < 0.005, compared with the DEHP only group; #p < 0.05, ##p < 0.01, ###p < 0.005, compared with the OVA only group.
