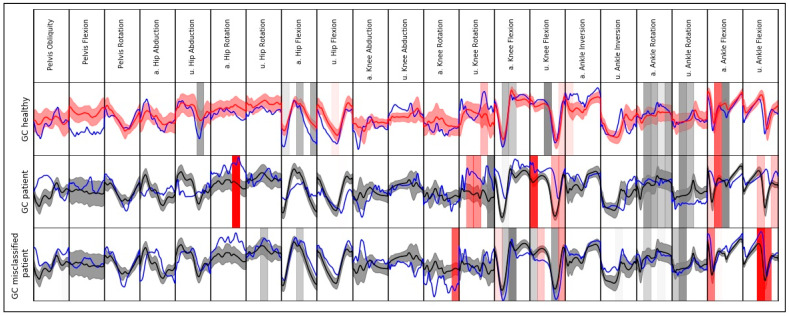
Figure 3.
Exemplary local model interpretation for single gait cycle (GC) (instance) of a patient with THA, a healthy subject, and a GC of a patient classified as healthy (blue lines). The instances are plotted against the mean value and standard deviation of the other class (black = healthy, red = patient). For better visualization, the top 20 slices with the highest absolute effect are displayed for each instance (grey vertical span = effect towards class of healthy subjects, red vertical span = effect towards class of patients with THA). The color saturation indicates the effect size. For visualization reasons, data are separately scaled to a range from 0 to 1 for each variable. Abbreviations: a. = affected side; u. = unaffected side.

