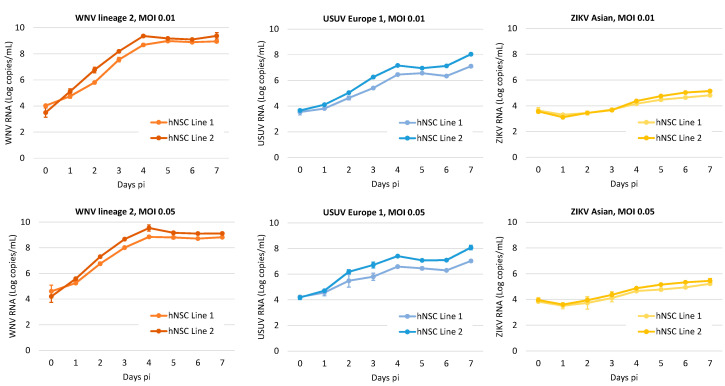
Figure 3.
WNV, USUV and ZIKV production kinetics on hiPSC-derived NSCs. Cells were infected with WNV lineage 2, USUV Europe 1 and ZIKV Asian lineage at MOI 0.01, and 0.05 and viral RNA load was measured in cell culture supernatant by qRT-PCR daily, from day 0 to day 7 post infection (pi). Cell growth medium was replaced daily. Viral RNA load is reported as Log copies/mL. Analyses were performed in duplicate and repeated in three independent experiments. Data represent mean values ± SD of all experiments.

