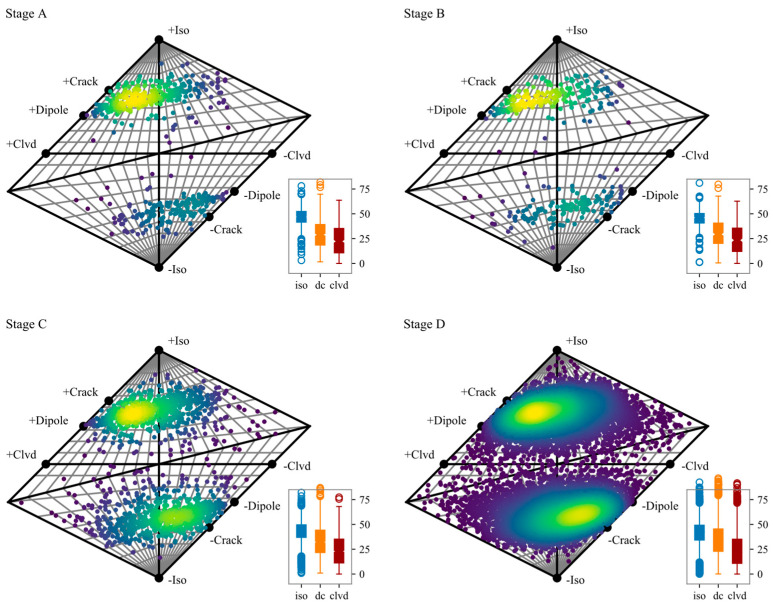
Figure 6.
Hudson diagram of the final optimized moment tensor solutions. The horizontal axis describes the type of constant volume component in the source (DC vs. CLVD), while the vertical axis presents the proportion of the volumetric variations. The box plot at right bottom describes the statistics of the specific ratio of each component in the moment tensor decomposition.

