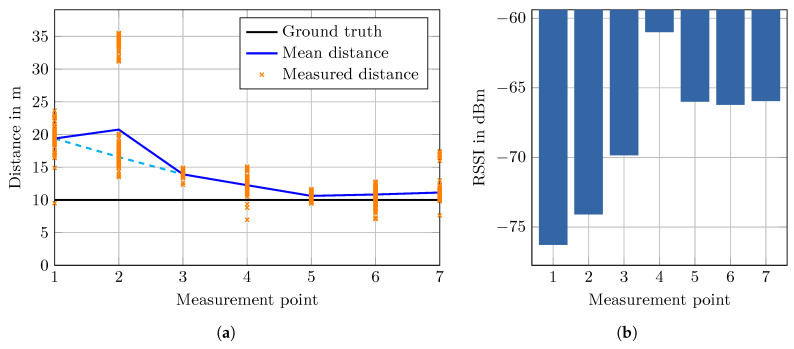
Figure 6.
Results for test setup as seen in Figure 5. (a) While the true distance (black line) is constant, the mean FTM measured distance (blue line) is not. At point 2, a bimodal distribution of measurements is apparent. If the more significant mode is used the error decreases monotonously (dashed cyan line). (b) Corresponding Received Signal Strength Indication (RSSI) values at each measurement point.

