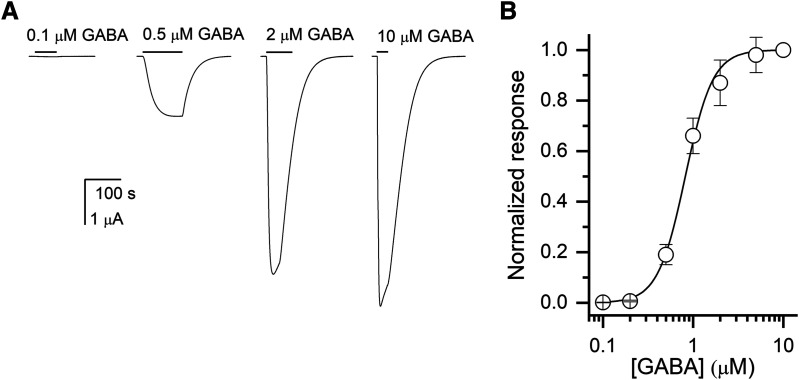
Fig. 2.
Activation of the ρ1 wild-type receptor by GABA. (A) Sample current responses to applications of 0.1, 0.5, 2, or 10 μM GABA. The bars indicate the durations of applications of GABA. The applications of GABA were followed by 2–4 minutes washes in ND96. (B) The GABA concentration-response relationship from oocytes exposed to 0.1–10 μM GABA. The current amplitudes were normalized to the response to 10 μM in the same cell. The data points show mean ± S.D. from five cells. The concentration-response data from each cell were fitted separately yielding an EC50 of 0.82 ± 0.09 μM (mean ± S.D.) and an nHill of 2.85 ± 0.45. The curve shows a calculated concentration-response relationship based on the mean EC50 and nHill.

