Fig. 6.
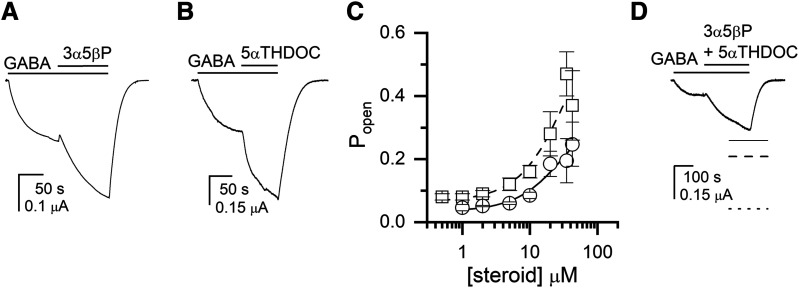
Potentiation of the ρ1(I307Q) receptor by 3α5βP, 5αTHDOC, and the combination of the two steroids. (A) A sample current response to 0.11 μM GABA (Popen = 0.05) followed by a coappplication of GABA + 10 μM 3α5βP. The bars above the traces indicate the durations of applications of the drugs. (B) A sample current response to 0.2 μM GABA (Popen = 0.1) followed by a coappplication of GABA + 10 μM 5αTHDOC. (C) The graph shows the steroid concentration-Popen relationships for 3α5βP (circles and solid line) and 5αTHDOC (squares and dashed line). The data points show mean ± S.D. from five to six cells at each experimental condition. The curves were generated by fitting eq. 2 to the pooled data. The best-fit parameters for 3α5βP are: KC = 20.5 ± 15.1 μM, c = 0.55 ± 0.05. The best-fit parameters for 5αTHDOC are: KC = 28.6 ± 26.1 μM, c = 0.49 ± 0.08. (D) A sample current response to 0.15 μM GABA (Popen = 0.03) followed by a coappplication of GABA + 10 μM 3α5βP + 10 μM 5αTHDOC. The dashed and dotted lines show theoretical current levels simulated by the models assuming same or distinct binding sites, respectively, for 5αTHDOC and 3α5βP. The solid line shows the estimated steady-state response level in the presence of GABA + 3α5βP + 5αTHDOC from the fit of a single exponential function.

