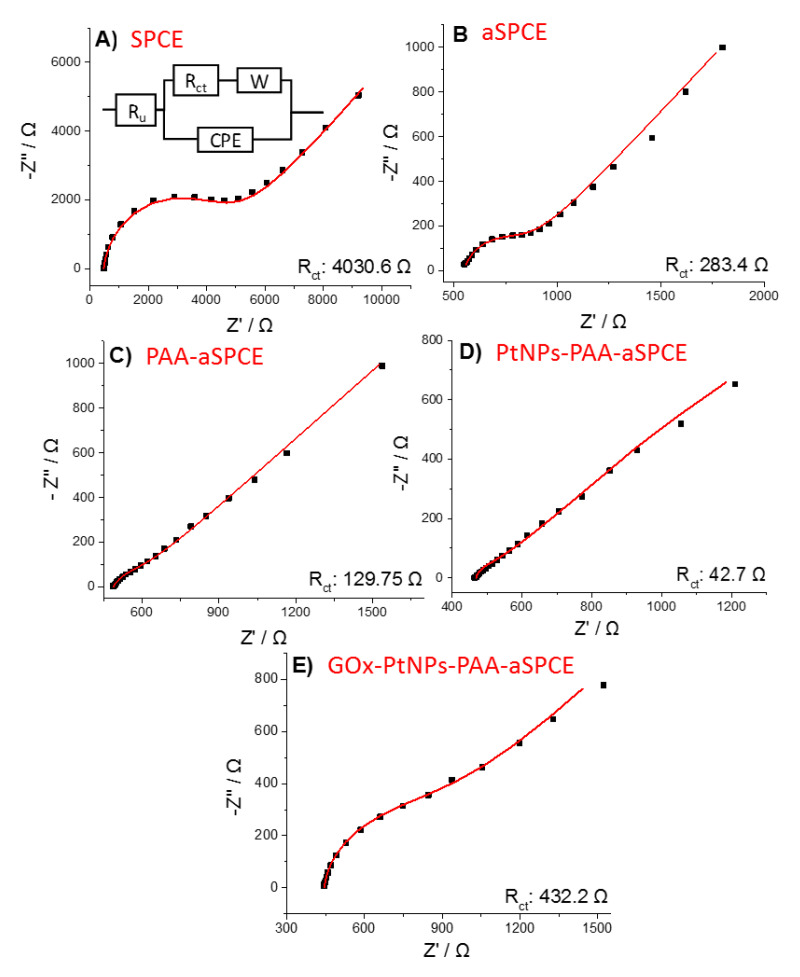
Figure 3.
Nyquist plots for the different steps of the working electrode modification: (A) SPCE,(B) aSPCE, (C) PAA-aSPCE, (D) PtNPs-PAA-aSPCE and (E) GOx-PtNPs-PAA-aSPCE. Electrochemical impedance spectroscopy (EIS) was recorded at 0.15 V (vs. Ag) in 1 mM Na4Fe(CN)6 (in 0.1 M KCl). Experimental conditions: stabilization time 60 s, amplitude 5 mV, and frequencies 65 kHz–10 mHz, with five points per decade. The inset in (A) shows the equivalent circuit used.

