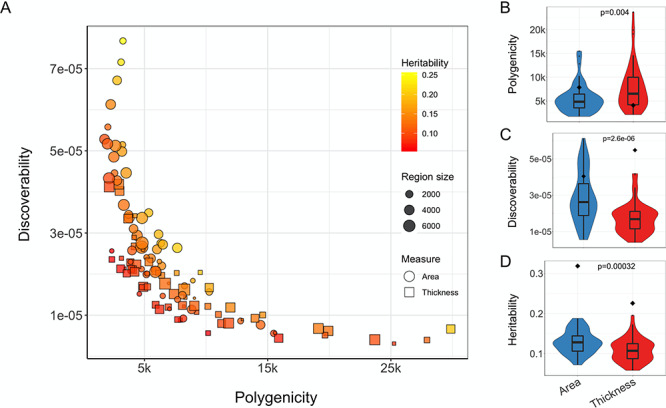
Figure 2.

Polygenicity, discoverability, and heritability of regional cortical surface area and thickness. (A) Scatter plot depicting the relationship between estimates of polygenicity (x-axis) and discoverability (y-axis) for regional cortical measures. The shape of the data points distinguishes between surface area and thickness estimates, the point size reflects the size of the region, and the color relates to the estimated heritability. (B–D) Violin plots comparing the polygenicity, discoverability, and heritability (on the y-axis) of regional area and thickness estimates (x-axis). Significance, indicated at the top of each graph, is calculated through the Wilcoxon signed-rank test. For comparison, the diamonds indicate the estimate for the corresponding global measure.
