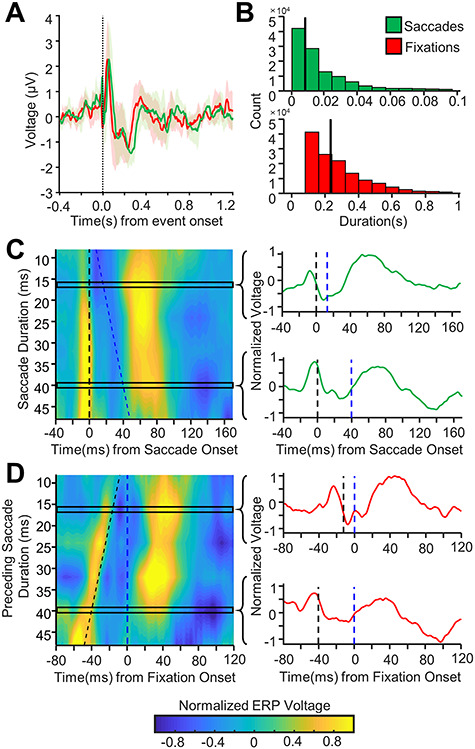
Figure 2.

Saccade versus fixation alignment of hippocampal response to eye movements. (A) Grand-average hippocampal ERP aligned to fixation (red) or saccade (green) onset (mean ± 95% confidence intervals). (B) Histogram of fixation and saccade lengths across all patients and trials. The vertical black line marks the median fixation and saccade duration respectively. (C) Left: Contour plot showing grand-average saccade-aligned ERPs for changing saccade durations (shorter saccade durations towards the top of the graph, longer durations towards the bottom) for all hippocampal electrodes. The x-axis shows time relative to saccade onset. Saccade onset is marked by the dashed black vertical line. Fixation onset is marked by the dashed blue line. Note that as the saccade duration changes, the response remains aligned to the saccade onset. Each response to saccade duration ERP appears to have a rapid voltage response at saccade onset likely due to extraocular muscle contractions (along the black dotted line), further discussed in the results under Analysis and Removal of the Peri-saccadic Transient. Right: the normalized ERP waveforms for two different rows of the contour plot is shown with the saccade onset marked with a dashed black line and fixation onset marked with the dashed blue line. Note, the saccade ERP is very similar for saccades of different durations across all electrodes. (D) Left: As C but for fixation-aligned ERPs. The y-axis shows the duration of saccade preceding the fixation. The x-axis shows time relative to fixation onset. Fixation onset is marked with the dashed blue line, and saccade onset is marked with the dashed black line. Right: the normalized ERP waveforms for two different rows of the contour plot are shown with the saccade and fixation onsets marked as before. Note that as the saccade duration changes, the waveform shifts to remain aligned with saccade onset.
